## Line Chart: Model Win Rates Across Domains
### Overview
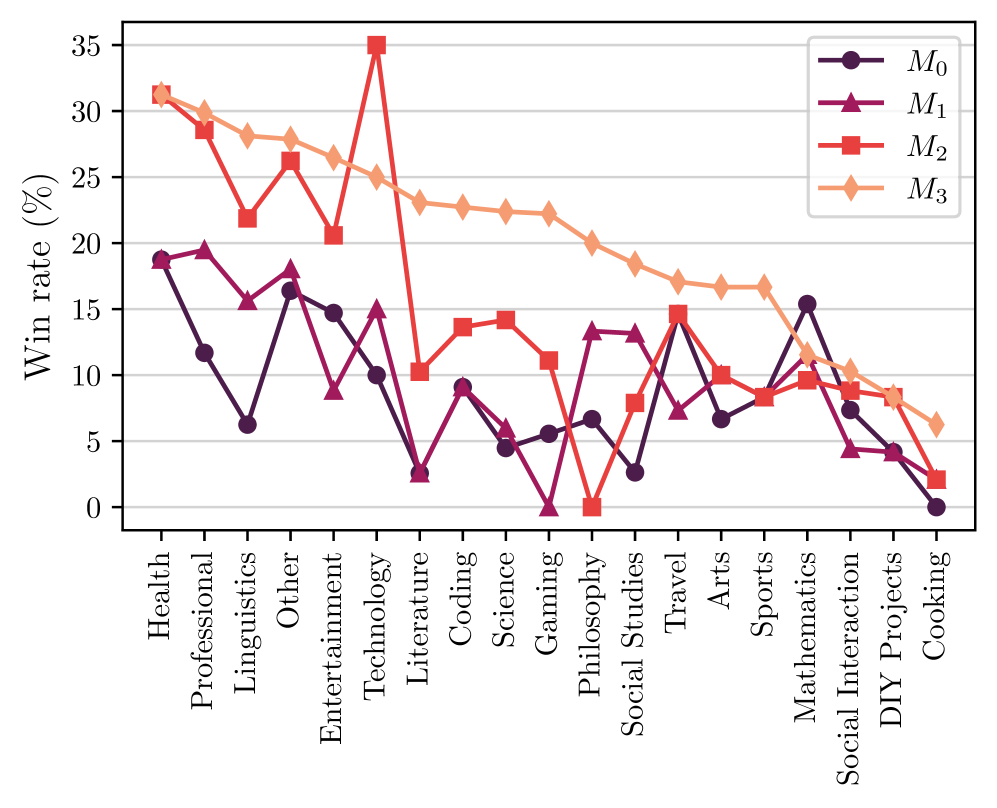
This is a multi-series line chart comparing the performance of four different models (M0, M1, M2, M3) across 20 distinct knowledge or activity domains. The performance metric is "Win rate (%)", plotted on the y-axis against the domain categories on the x-axis. The chart reveals significant variability in model performance depending on the subject matter.
### Components/Axes
* **Y-Axis:** Labeled "Win rate (%)". Scale ranges from 0 to 35, with major gridlines at intervals of 5 (0, 5, 10, 15, 20, 25, 30, 35).
* **X-Axis:** Lists 20 domain categories. From left to right: Health, Professional, Linguistics, Other, Entertainment, Technology, Literature, Coding, Science, Gaming, Philosophy, Social Studies, Travel, Arts, Sports, Mathematics, Social Interaction, DIY Projects, Cooking.
* **Legend:** Positioned in the top-right corner of the chart area. It defines four data series:
* **M0:** Dark purple line with circle markers.
* **M1:** Purple line with upward-pointing triangle markers.
* **M2:** Red line with square markers.
* **M3:** Orange line with diamond markers.
### Detailed Analysis
Below are the approximate win rates (%) for each model across all domains. Values are estimated from the chart's gridlines.
| Domain | M0 (Dark Purple, Circle) | M1 (Purple, Triangle) | M2 (Red, Square) | M3 (Orange, Diamond) |
| :--- | :--- | :--- | :--- | :--- |
| **Health** | ~19 | ~19 | ~31 | ~31 |
| **Professional** | ~12 | ~19 | ~28 | ~30 |
| **Linguistics** | ~6 | ~15 | ~22 | ~28 |
| **Other** | ~16 | ~18 | ~26 | ~28 |
| **Entertainment** | ~15 | ~9 | ~21 | ~26 |
| **Technology** | ~10 | ~15 | **~35** | ~25 |
| **Literature** | ~3 | ~3 | ~10 | ~23 |
| **Coding** | ~9 | ~9 | ~14 | ~23 |
| **Science** | ~5 | ~6 | ~14 | ~22 |
| **Gaming** | ~6 | **~0** | ~11 | ~22 |
| **Philosophy** | ~7 | ~13 | **~0** | ~20 |
| **Social Studies** | ~3 | ~13 | ~8 | ~18 |
| **Travel** | ~14 | ~8 | ~15 | ~17 |
| **Arts** | ~7 | ~10 | ~10 | ~17 |
| **Sports** | ~8 | ~8 | ~8 | ~17 |
| **Mathematics** | ~15 | ~11 | ~10 | ~12 |
| **Social Interaction** | ~8 | ~5 | ~10 | ~11 |
| **DIY Projects** | ~4 | ~4 | ~8 | ~9 |
| **Cooking** | **~0** | ~2 | ~2 | ~6 |
**Trend Verification per Series:**
* **M0 (Dark Purple):** Shows a generally volatile, downward trend from left to right, starting around 19% and ending at 0%. It has notable peaks in Health, Other, Travel, and Mathematics.
* **M1 (Purple):** Also volatile with a slight downward trend. It starts around 19%, dips to near 0% at Gaming, recovers, and ends around 2%. Peaks are in Health, Professional, and Philosophy.
* **M2 (Red):** Exhibits the most dramatic fluctuations. It starts very high (~31%), peaks sharply at Technology (~35%), crashes to 0% at Philosophy, and ends very low (~2%). It shows strong performance in technical and professional domains but fails completely in Philosophy.
* **M3 (Orange):** Displays the most consistent and clear trend: a steady, almost linear decline from left to right. It starts as the top performer (~31% in Health) and gradually decreases to the lowest performer in Cooking (~6%). It never drops to zero and maintains a relatively smooth descent.
### Key Observations
1. **Domain Specialization:** No single model dominates all domains. M3 is strongest in the first half (Health to Science), M2 has a massive spike in Technology, and M0 is relatively strong in Mathematics.
2. **Catastrophic Failures:** Three models hit a 0% win rate in specific domains: M1 in Gaming, M2 in Philosophy, and M0 in Cooking. This suggests complete inability or failure in those specific contexts.
3. **Performance Clustering:** In domains like Sports and DIY Projects, all models perform within a narrow, low range (roughly 4-17%), indicating these are challenging areas for all tested models.
4. **Inverse Relationships:** In several domains (e.g., Technology, Philosophy), the performance of M2 is inversely related to the others—when M2 peaks or crashes, the other models show more moderate values.
### Interpretation
This chart likely compares the efficacy of different AI models or algorithms on a benchmark suite covering diverse topics. The "Win rate" probably represents the percentage of test cases or prompts where a given model produced the best or a satisfactory answer compared to its peers.
The data suggests that model architecture or training data creates strong domain biases. **M3's** smooth decline might indicate a model trained on a broad but general corpus, performing well on common topics (Health, Professional) but lacking depth in specialized or practical areas (Cooking, DIY). **M2's** profile is that of a "specialist"—exceptionally strong in Technology (perhaps due to technical training data) but brittle, failing completely in abstract reasoning (Philosophy). **M0 and M1** show more erratic performance, which could indicate less stable training or sensitivity to specific prompt phrasings within each domain.
The complete failures (0% win rate) are critical findings. They don't just indicate poor performance but a fundamental breakdown, which could be due to training data gaps, algorithmic flaws in handling certain query types, or safety filters being overly triggered. The clustering of low scores in hands-on domains (Sports, DIY, Cooking) across all models highlights a current limitation in AI's ability to reason about physical, procedural, or experiential knowledge compared to textual or technical information.