# Technical Document: Line Graph Analysis
## Labels and Axis Titles
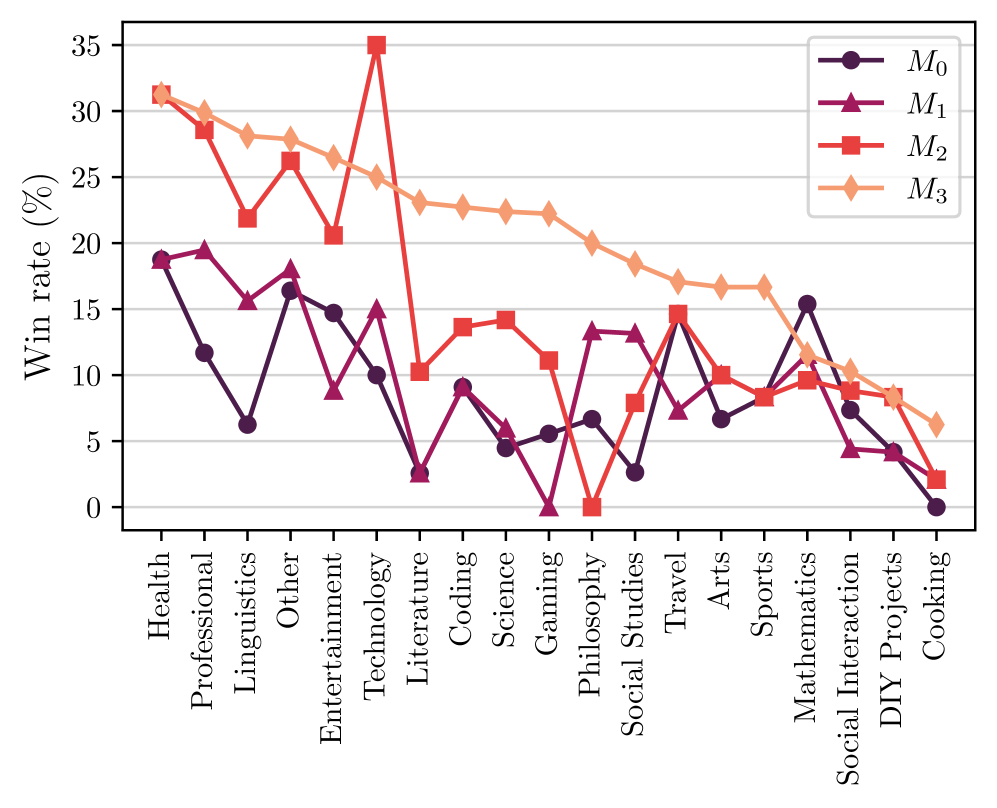
- **Y-Axis**: "Win rate (%)" with increments from 0 to 35%.
- **X-Axis**: Categories representing different fields or domains (see list below).
- **Legend**:
- **M₀**: Purple circles (solid line).
- **M₁**: Pink triangles (dashed line).
- **M₂**: Red squares (dotted line).
- **M₃**: Orange diamonds (dash-dot line).
## X-Axis Categories
1. Health
2. Professional
3. Linguistics
4. Other
5. Entertainment
6. Technology
7. Literature
8. Coding
9. Gaming
10. Philosophy
11. Social Studies
12. Travel
13. Arts
14. Sports
15. Mathematics
16. Social Interaction
17. DIY Projects
18. Cooking
## Key Trends and Data Points
1. **M₃ (Orange Diamonds)**:
- Consistently highest win rate across most categories.
- Starts at ~32% in "Health" and declines steadily to ~6% in "Cooking".
- Notable peaks: ~30% in "Professional" and "Linguistics".
2. **M₂ (Red Squares)**:
- Sharp peak at **35%** in "Technology".
- Significant drop in "Philosophy" (near 0%).
- Moderate performance in "Coding" (~14%) and "Gaming" (~11%).
3. **M₀ (Purple Circles)**:
- Highest in "Health" (~19%) and "Other" (~16%).
- Dips below 5% in "Philosophy" and "Social Studies".
- Recovers slightly in "Sports" (~16%) and "Mathematics" (~16%).
4. **M₁ (Pink Triangles)**:
- Peaks at ~20% in "Health" and "Other".
- Sharp decline in "Gaming" (~0%).
- Moderate performance in "Travel" (~15%) and "Arts" (~10%).
## Observations
- **M₃** dominates in most categories, suggesting superior performance or specialization.
- **M₂** excels in "Technology" but struggles in "Philosophy".
- **M₀** and **M₁** show variability, with M₀ performing better in technical fields (e.g., "Coding", "Sports") and M₁ in creative domains (e.g., "Arts", "Travel").
- All models decline in "Cooking", indicating potential weakness in this category.
## Cross-Referenced Legend and Line Accuracy
- Colors and markers align perfectly with legend labels (e.g., M₃’s orange diamonds match the orange dash-dot line).
- No discrepancies detected between legend and plotted data.