## Radar Chart: Performance Comparison of CoT, ToT, and GoT Across Difficulty Levels
### Overview
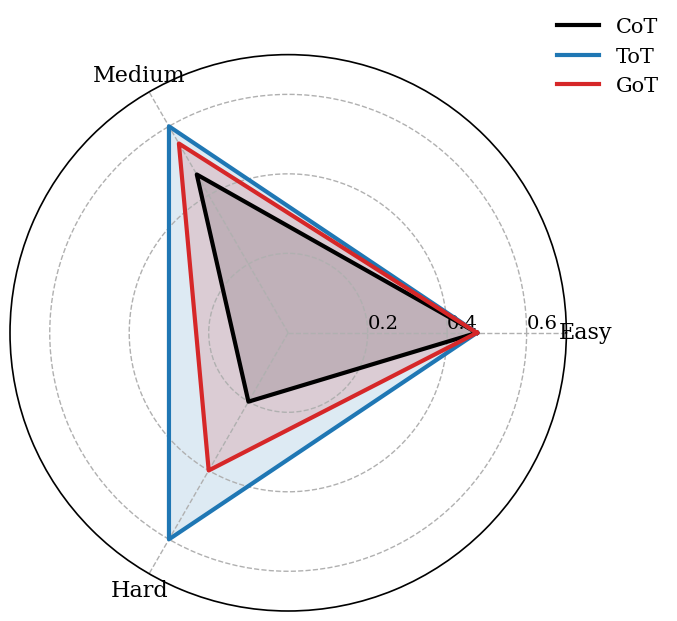
The image is a radar chart (spider plot) comparing the performance of three distinct methods or models—labeled CoT, ToT, and GoT—across three difficulty categories: Easy, Medium, and Hard. The chart uses a triangular axis layout with concentric circles as scale markers. The data suggests a performance evaluation, likely in a problem-solving or reasoning task context.
### Components/Axes
* **Chart Type:** Radar/Spider Chart.
* **Axes (Categories):** Three axes radiate from the center, labeled:
* **Easy** (positioned at the 3 o'clock position, right side).
* **Medium** (positioned at the 11 o'clock position, top-left).
* **Hard** (positioned at the 7 o'clock position, bottom-left).
* **Scale:** Concentric dashed circles represent the radial scale. The visible markers are labeled:
* **0.2** (inner circle)
* **0.4** (middle circle)
* **0.6** (outer circle, forming the chart's boundary).
* **Legend:** Located in the top-right corner of the image. It defines the three data series:
* **CoT:** Represented by a **black line** and a semi-transparent grey filled area.
* **ToT:** Represented by a **blue line** and a semi-transparent light blue filled area.
* **GoT:** Represented by a **red line** and a semi-transparent pink/red filled area.
### Detailed Analysis
**Data Series & Approximate Values:**
The performance value for each method on each axis is determined by how far its line extends along that axis from the center.
1. **CoT (Black Line):**
* **Trend:** Forms the innermost triangle, indicating the lowest overall performance.
* **Easy Axis:** Extends to approximately **0.4**.
* **Medium Axis:** Extends to approximately **0.3**.
* **Hard Axis:** Extends to approximately **0.25**.
* **Pattern:** Performance decreases as task difficulty increases.
2. **ToT (Blue Line):**
* **Trend:** Forms the outermost triangle, indicating the highest overall performance.
* **Easy Axis:** Extends to the maximum value of **0.6**.
* **Medium Axis:** Extends to approximately **0.55**.
* **Hard Axis:** Extends to approximately **0.5**.
* **Pattern:** Maintains high performance across all levels, with a slight decrease from Easy to Hard.
3. **GoT (Red Line):**
* **Trend:** Forms a triangle positioned between CoT and ToT.
* **Easy Axis:** Extends to the maximum value of **0.6**, matching ToT.
* **Medium Axis:** Extends to approximately **0.5**.
* **Hard Axis:** Extends to approximately **0.4**.
* **Pattern:** Matches the top performance on Easy tasks but shows a more pronounced drop-off on Medium and Hard tasks compared to ToT.
**Spatial Grounding & Cross-Reference:**
* The legend is clearly separated in the top-right and does not overlap the chart data.
* The color mapping is consistent: Black=CoT, Blue=ToT, Red=GoT. The filled areas correspond to their respective line colors.
* All three lines converge at the **0.6** point on the **Easy** axis, indicating equal peak performance for ToT and GoT, with CoT reaching a lower value (0.4) on the same axis.
### Key Observations
1. **Universal Peak on "Easy":** All methods achieve their highest score on the "Easy" axis. ToT and GoT both reach the chart's maximum value (0.6).
2. **Performance Hierarchy:** A clear and consistent hierarchy is visible across all difficulty levels: **ToT > GoT > CoT**.
3. **Difficulty Impact:** Performance for all methods degrades as task difficulty increases from Easy to Hard. The rate of degradation varies: CoT and GoT show a steeper decline than ToT.
4. **Convergence Point:** The only point where two methods (ToT and GoT) have identical performance is on the "Easy" task axis.
### Interpretation
This chart visually demonstrates the comparative effectiveness of three different approaches (likely reasoning or problem-solving frameworks, given the common acronyms CoT for Chain-of-Thought, ToT for Tree-of-Thought, and GoT for Graph-of-Thought) as a function of task difficulty.
* **What the data suggests:** The **ToT (Tree-of-Thought)** method is the most robust and effective across the board, maintaining high performance even as tasks become harder. **GoT (Graph-of-Thought)** is highly effective for easy problems but is less scalable to complex tasks than ToT. **CoT (Chain-of-Thought)** is the least effective method shown, particularly for medium and hard problems.
* **Relationship between elements:** The triangular layout directly maps performance to difficulty. The area enclosed by each method's polygon can be interpreted as its overall "capability space." ToT's larger area signifies greater general capability.
* **Notable Anomaly/Insight:** The fact that GoT matches ToT on easy tasks but falls behind on harder ones suggests that the additional structural complexity of a graph (GoT) may not provide benefits over a tree structure (ToT) for simple problems, but becomes a limiting factor for complex ones compared to the tree's organized hierarchy. The chart argues for the superiority of the Tree-of-Thought approach in this specific evaluation context.