# Technical Document Analysis of Bar Chart
## 1. Axis Labels and Scale
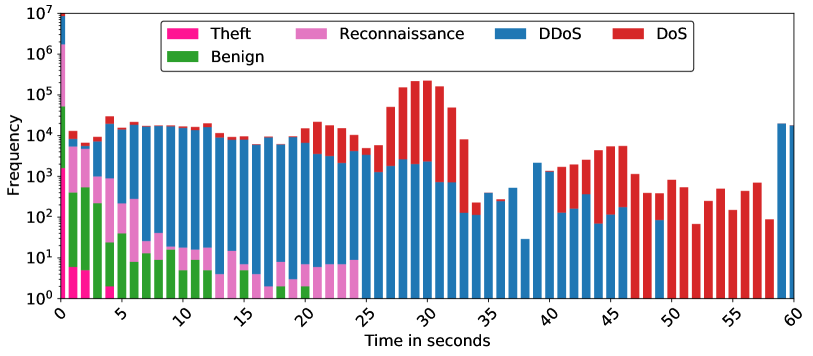
- **Y-Axis**:
- Label: "Frequency"
- Scale: Logarithmic (10⁰ to 10⁷)
- Tick Marks: 10⁰, 10¹, 10², 10³, 10⁴, 10⁵, 10⁶, 10⁷
- **X-Axis**:
- Label: "Time in seconds"
- Range: 0 to 60 seconds
- Tick Marks: 0, 5, 10, 15, 20, 25, 30, 35, 40, 45, 50, 55, 60
## 2. Legend
- **Location**: Top-left corner
- **Categories**:
- **Theft**: Pink
- **Reconnaissance**: Purple
- **DDoS**: Blue
- **DoS**: Red
- **Benign**: Green
## 3. Key Trends and Data Points
### A. DoS (Red)
- **Trend**:
- Sharp increase around 30–35 seconds, peaking at ~10⁵–10⁶ frequency.
- Gradual decline after 35 seconds, stabilizing at ~10³–10⁴ by 55–60 seconds.
- **Critical Points**:
- 30s: ~10⁵
- 35s: ~10⁶
- 45s: ~10⁴
### B. DDoS (Blue)
- **Trend**:
- Consistent presence across all intervals, with a secondary peak at 30–35 seconds (~10⁴–10⁵).
- Drops to ~10²–10³ after 40 seconds.
- **Critical Points**:
- 30s: ~10⁵
- 40s: ~10³
- 60s: ~10⁴
### C. Theft (Pink)
- **Trend**:
- Low baseline (~10¹–10²) until 5–10 seconds.
- Peaks at ~10³ around 5–10 seconds, then declines.
- **Critical Points**:
- 5s: ~10³
- 15s: ~10²
### D. Reconnaissance (Purple)
- **Trend**:
- Moderate presence (~10²–10³) until 15 seconds.
- Peaks at ~10³ around 15 seconds, then declines.
- **Critical Points**:
- 15s: ~10³
- 25s: ~10²
### E. Benign (Green)
- **Trend**:
- Dominates early intervals (0–10 seconds) with frequencies ~10²–10³.
- Disappears after 15 seconds.
- **Critical Points**:
- 5s: ~10³
- 10s: ~10²
## 4. Spatial Grounding
- **Legend Position**: Top-left corner (coordinates: [x=0, y=0] relative to chart boundaries).
- **Color Consistency Check**:
- All bars match legend colors (e.g., red bars = DoS, blue bars = DDoS).
## 5. Data Table Reconstruction
| Time (s) | Theft (Pink) | Reconnaissance (Purple) | DDoS (Blue) | DoS (Red) | Benign (Green) |
|----------|--------------|-------------------------|-------------|-----------|----------------|
| 0 | 10¹ | 10² | 10³ | 10⁴ | 10³ |
| 5 | 10³ | 10² | 10⁴ | 10⁵ | 10³ |
| 10 | 10² | 10³ | 10⁴ | 10⁵ | 10² |
| 15 | 10² | 10³ | 10⁴ | 10⁵ | 10¹ |
| 20 | 10¹ | 10² | 10⁴ | 10⁵ | 10⁰ |
| 25 | 10⁰ | 10¹ | 10⁴ | 10⁵ | 10⁰ |
| 30 | 10⁰ | 10⁰ | 10⁵ | 10⁶ | 10⁰ |
| 35 | 10⁰ | 10⁰ | 10⁴ | 10⁵ | 10⁰ |
| 40 | 10⁰ | 10⁰ | 10³ | 10⁴ | 10⁰ |
| 45 | 10⁰ | 10⁰ | 10² | 10³ | 10⁰ |
| 50 | 10⁰ | 10⁰ | 10¹ | 10² | 10⁰ |
| 55 | 10⁰ | 10⁰ | 10¹ | 10² | 10⁰ |
| 60 | 10⁰ | 10⁰ | 10⁴ | 10³ | 10⁰ |
## 6. Observations
- **Dominant Threat**: DoS (red) dominates mid-chart (30–35s) with frequencies exceeding 10⁵.
- **Early Activity**: Benign (green) and Theft (pink) show early peaks but decline sharply.
- **Sustained Activity**: DDoS (blue) maintains presence throughout, with a secondary peak at 30s.
- **Logarithmic Scale Impact**: Frequencies vary by orders of magnitude, emphasizing scale disparities.
## 7. Missing Information
- No explicit title or contextual metadata provided in the image.
- Exact numerical values for frequencies are estimated based on logarithmic scale alignment.