# Technical Data Extraction: Network Traffic Frequency Analysis
## 1. Document Overview
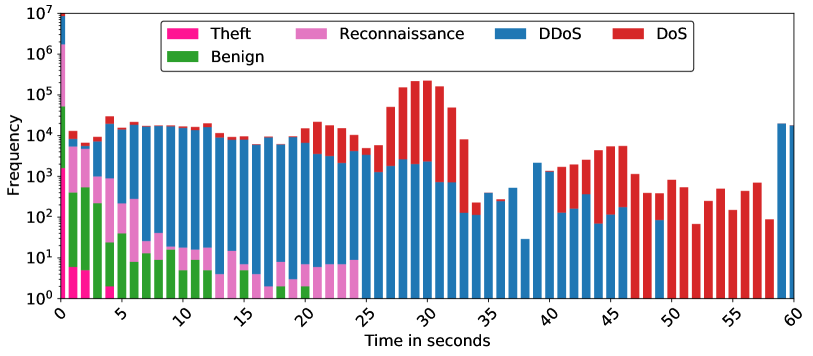
This image is a stacked bar chart representing the frequency of different types of network traffic (Benign and various attack types) over a duration of 60 seconds. The Y-axis uses a logarithmic scale to accommodate a wide range of frequency values.
## 2. Axis and Legend Identification
### Axis Labels
* **Y-Axis (Vertical):** `Frequency`
* **Scale:** Logarithmic ($10^0$ to $10^7$).
* **Markers:** $10^0, 10^1, 10^2, 10^3, 10^4, 10^5, 10^6, 10^7$.
* **X-Axis (Horizontal):** `Time in seconds`
* **Range:** 0 to 60 seconds.
* **Markers:** Increments of 5 ($0, 5, 10, 15, 20, 25, 30, 35, 40, 45, 50, 55, 60$).
### Legend
| Category | Color |
| :--- | :--- |
| **Theft** | Deep Pink / Magenta |
| **Reconnaissance** | Light Pink / Orchid |
| **DDoS** | Blue |
| **DoS** | Red |
| **Benign** | Green |
---
## 3. Component Isolation and Data Trends
### Region 1: Initial Burst (0 - 2 seconds)
* **Trend:** Massive spike at $t=0$, followed by a sharp decline.
* **Data Points:**
* At **0 seconds**, there is a stacked column reaching $10^7$. It contains all categories, with **DDoS (Blue)** and **Reconnaissance (Light Pink)** being the most frequent.
* At **1-2 seconds**, **Theft (Deep Pink)** and **Reconnaissance (Light Pink)** are visible at frequencies between $10^3$ and $10^4$.
### Region 2: Benign and Mixed Activity (3 - 12 seconds)
* **Trend:** **Benign (Green)** traffic is most prominent in this window, peaking around 4-5 seconds and tapering off by 12 seconds. **DDoS (Blue)** remains a constant background presence.
* **Data Points:**
* **Benign (Green):** Peaks at ~5 seconds with a frequency of approx. $5 \times 10^2$.
* **DDoS (Blue):** Maintains a steady frequency of approx. $10^4$ throughout this period.
### Region 3: DDoS Dominance (13 - 25 seconds)
* **Trend:** **DDoS (Blue)** traffic is the primary component. **Reconnaissance (Light Pink)** shows small intermittent blocks at the base of the bars.
* **Data Points:**
* **DDoS (Blue):** Frequency fluctuates between $5 \times 10^3$ and $10^4$.
* **DoS (Red):** Small amounts of DoS traffic begin to appear on top of the DDoS bars around 20-24 seconds.
### Region 4: Major DoS Attack (26 - 33 seconds)
* **Trend:** A significant surge in **DoS (Red)** traffic, forming a "hump" or bell-curve shape on top of the DDoS traffic.
* **Data Points:**
* **Peak:** At **30 seconds**, the total frequency reaches its second-highest point (approx. $2 \times 10^5$), dominated by **DoS (Red)**.
* **DDoS (Blue):** Remains steady at the base with a frequency of approx. $10^3$.
### Region 5: Late Activity and Second DoS Wave (34 - 60 seconds)
* **Trend:** Traffic becomes more sporadic. A second, smaller wave of **DoS (Red)** occurs between 40-47 seconds. The final seconds show a return of **DDoS (Blue)**.
* **Data Points:**
* **35-38 seconds:** Mostly **DDoS (Blue)** at lower frequencies ($10^1$ to $10^2$).
* **40-47 seconds:** **DoS (Red)** peaks again at approx. $5 \times 10^3$.
* **48-58 seconds:** Exclusively **DoS (Red)** traffic at frequencies between $10^2$ and $10^3$.
* **59-60 seconds:** A sudden return of **DDoS (Blue)** traffic at approx. $2 \times 10^4$.
---
## 4. Summary of Findings
* **Highest Volume:** Occurs at the start ($t=0$) and during the DoS attack ($t=30$).
* **Primary Threat:** **DDoS (Blue)** is the most persistent traffic type throughout the 60-second window.
* **Attack Patterns:**
* **Reconnaissance** and **Theft** are localized to the first 5 seconds.
* **Benign** traffic is only significant in the first 12 seconds.
* **DoS** occurs in two distinct phases: a major surge at 30s and a secondary wave at 45s.