## Chart/Diagram Type: Compound Image - Heatmap and Flowchart
### Overview
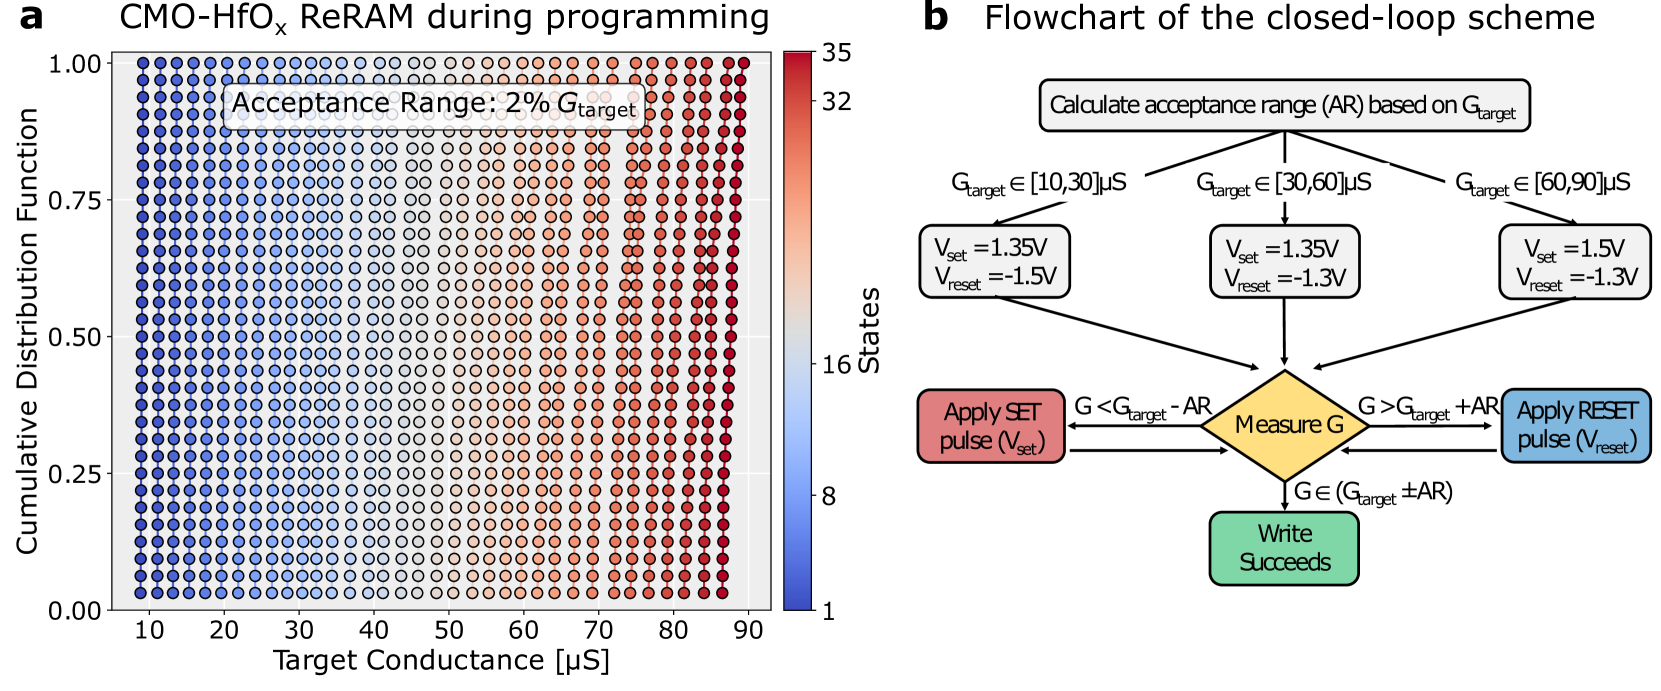
The image consists of two sub-figures: (a) a heatmap showing the cumulative distribution function of a CMO-HfOₓ ReRAM during programming, and (b) a flowchart illustrating the closed-loop scheme used in the programming process.
### Components/Axes
**Sub-figure (a): Heatmap**
* **Title:** CMO-HfOₓ ReRAM during programming
* **X-axis:** Target Conductance [µS]
* Scale: 10 to 90 µS, with tick marks every 10 µS (10, 20, 30, 40, 50, 60, 70, 80, 90)
* **Y-axis:** Cumulative Distribution Function
* Scale: 0.00 to 1.00, with tick marks every 0.25 (0.00, 0.25, 0.50, 0.75, 1.00)
* **Colorbar (right side):** States
* Scale: 1 to 35, with tick marks at 1, 8, 16, 32, and 35. The color gradient ranges from blue (low states) to red (high states).
* **Annotation:** "Acceptance Range: 2% Gtarget" located near the top of the heatmap.
**Sub-figure (b): Flowchart**
* **Title:** Flowchart of the closed-loop scheme
* **Nodes:**
* Calculate acceptance range (AR) based on Gtarget (top)
* Gtarget ∈ [10,30]µS
* Vset = 1.35V
* Vreset = -1.5V
* Gtarget ∈ [30,60]µS
* Vset = 1.35V
* Vreset = -1.3V
* Gtarget ∈ [60,90]µS
* Vset = 1.5V
* Vreset = -1.3V
* Apply SET pulse (Vset) (red rounded rectangle)
* Measure G (yellow diamond)
* Apply RESET pulse (Vreset) (blue rounded rectangle)
* Write Succeeds (green rounded rectangle)
* **Edges:** Arrows indicating the flow of the process.
* **Conditions:**
* G < Gtarget - AR
* G > Gtarget + AR
* G ∈ (Gtarget ± AR)
### Detailed Analysis or Content Details
**Sub-figure (a): Heatmap**
* The heatmap shows the distribution of states for different target conductance values.
* At lower target conductance values (around 10-30 µS), the cumulative distribution function tends to have lower state values (blue color).
* As the target conductance increases (towards 80-90 µS), the cumulative distribution function shifts towards higher state values (red color).
* The color gradient indicates a gradual transition from low to high states as the target conductance increases.
* The "Acceptance Range" annotation indicates a tolerance of 2% around the target conductance.
**Sub-figure (b): Flowchart**
* The flowchart describes an iterative process for programming the ReRAM.
* The process starts by calculating the acceptance range (AR) based on the target conductance (Gtarget).
* Depending on the range of Gtarget, different SET and RESET voltages are applied.
* The conductance (G) is measured, and based on whether it's within the acceptance range (Gtarget ± AR), either a SET or RESET pulse is applied, or the write is considered successful.
* The process loops back to the "Measure G" step until the desired conductance is achieved.
### Key Observations
* The heatmap shows a clear correlation between target conductance and the distribution of states.
* The flowchart illustrates a closed-loop feedback mechanism for precise control of the ReRAM programming.
* The acceptance range (2% Gtarget) plays a crucial role in determining the success of the programming.
### Interpretation
The data suggests that the CMO-HfOₓ ReRAM programming process is controllable and predictable. The heatmap demonstrates that the target conductance significantly influences the resulting state distribution. The closed-loop scheme, as depicted in the flowchart, allows for fine-tuning of the ReRAM's conductance by iteratively applying SET and RESET pulses based on the measured conductance value and the defined acceptance range. This feedback mechanism ensures that the ReRAM is programmed to the desired state with high precision. The different voltage levels for different Gtarget ranges suggest an optimization strategy to improve programming efficiency and accuracy.