\n
## Heatmap & Flowchart: CMO-HfOx ReRAM Programming & Closed-Loop Scheme
### Overview
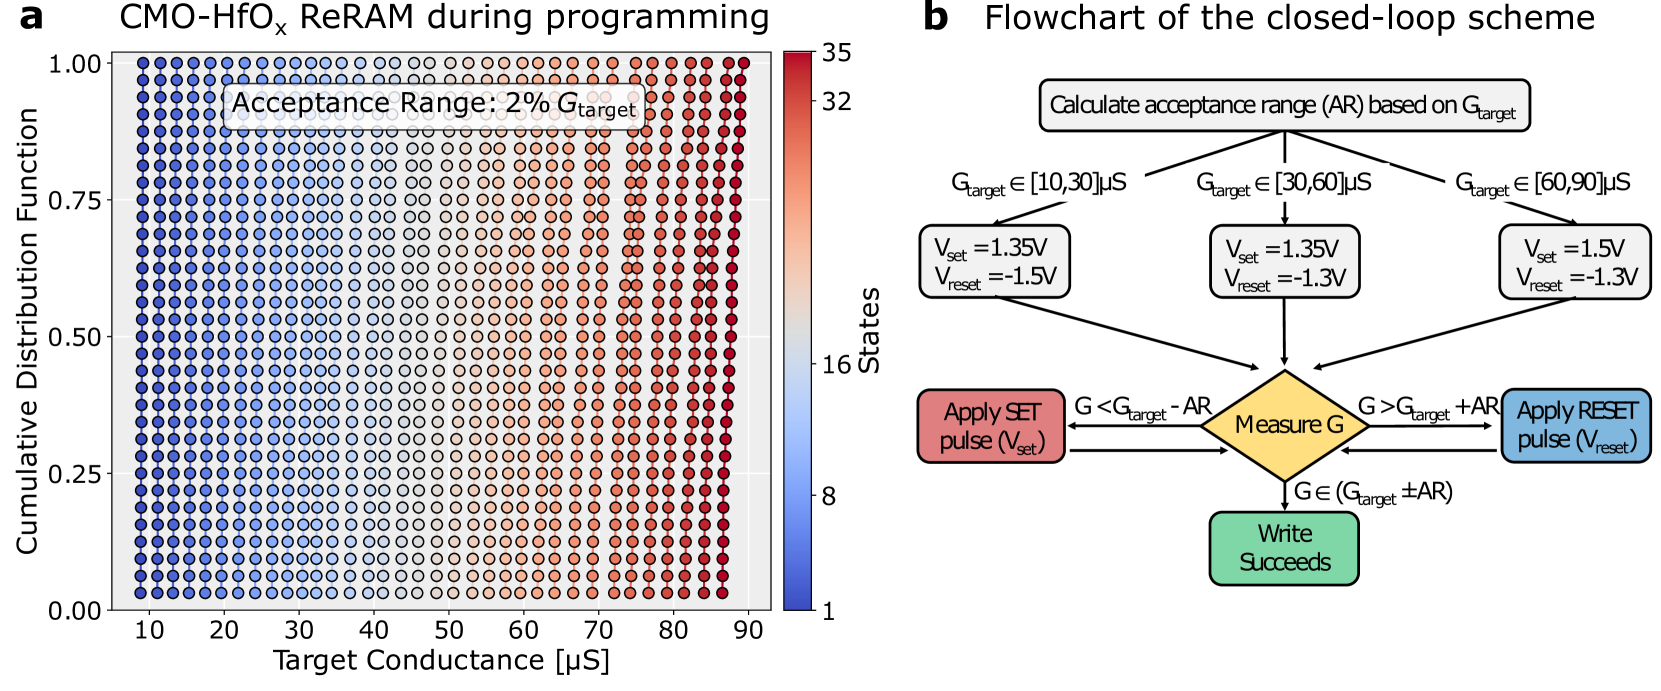
The image presents two distinct visualizations. The left side (a) is a heatmap illustrating the cumulative distribution function of CMO-HfOx ReRAM during programming, plotted against target conductance. The right side (b) is a flowchart detailing the closed-loop scheme used for programming the ReRAM.
### Components/Axes
**Heatmap (a):**
* **Title:** CMO-HfOx ReRAM during programming
* **X-axis:** Target Conductance [µS] (Scale: 0 to 90, with markers at 10, 20, 30, 40, 50, 60, 70, 80)
* **Y-axis:** Cumulative Distribution Function (Scale: 0.00 to 1.00, with markers at 0.00, 0.25, 0.50, 0.75, 1.00)
* **Color Scale:** Ranges from 1 (blue) to 35 (red). The color scale is positioned vertically on the right side of the heatmap.
* **Annotation:** "Acceptance Range: 2% Gtarget" is placed in the top-left region of the heatmap.
**Flowchart (b):**
* **Title:** Flowchart of the closed-loop scheme
* **Nodes:** "Calculate acceptance range (AR) based on Gtarget", "Gtarget ∈ [10,30]µS", "Gtarget ∈ [30,60]µS", "Gtarget ∈ [60,90]µS", "Apply SET pulse (Vset)", "Measure G", "Apply RESET pulse (Vreset)", "Write Succeeds".
* **Decision Points:** G < Gtarget - AR, G > Gtarget + AR, G ∈ (Gtarget ± AR)
* **Voltage Values:** Vset = 1.35V (appears three times), Vreset = -1.5V (appears twice), Vreset = -1.3V (appears once).
* **Arrows:** Indicate the flow of the scheme.
### Detailed Analysis or Content Details
**Heatmap (a):**
The heatmap shows a generally increasing trend in cumulative distribution function with increasing target conductance. The color transitions from blue (low cumulative distribution) to red (high cumulative distribution).
* At a Target Conductance of 10 µS, the Cumulative Distribution Function is approximately 0.05.
* At a Target Conductance of 20 µS, the Cumulative Distribution Function is approximately 0.20.
* At a Target Conductance of 30 µS, the Cumulative Distribution Function is approximately 0.35.
* At a Target Conductance of 40 µS, the Cumulative Distribution Function is approximately 0.50.
* At a Target Conductance of 50 µS, the Cumulative Distribution Function is approximately 0.60.
* At a Target Conductance of 60 µS, the Cumulative Distribution Function is approximately 0.70.
* At a Target Conductance of 70 µS, the Cumulative Distribution Function is approximately 0.80.
* At a Target Conductance of 80 µS, the Cumulative Distribution Function is approximately 0.90.
* At a Target Conductance of 90 µS, the Cumulative Distribution Function is approximately 0.95.
**Flowchart (b):**
The flowchart describes a closed-loop programming scheme.
1. The process begins with calculating an acceptance range (AR) based on the target conductance (Gtarget).
2. Based on the Gtarget value, different voltage values are applied.
* If Gtarget is between 10 and 30 µS, Vset = 1.35V and Vreset = -1.5V.
* If Gtarget is between 30 and 60 µS, Vset = 1.35V and Vreset = -1.3V.
* If Gtarget is between 60 and 90 µS, Vset = 1.5V and Vreset = -1.3V.
3. A SET pulse (Vset) is applied.
4. The conductance (G) is measured.
5. Decision points:
* If G < Gtarget - AR, a RESET pulse (Vreset) is applied.
* If G > Gtarget + AR, a SET pulse (Vset) is applied.
* If G is within the acceptance range (G ∈ (Gtarget ± AR)), the write succeeds.
### Key Observations
* The heatmap shows a relatively smooth increase in the cumulative distribution function with increasing target conductance, suggesting a consistent programming behavior.
* The acceptance range annotation on the heatmap indicates a tolerance of 2% around the target conductance.
* The flowchart demonstrates a feedback mechanism where the conductance is measured after each pulse and the next pulse is determined based on the measured value.
* The voltage values for SET and RESET pulses vary depending on the target conductance range.
### Interpretation
The data suggests a controlled programming process for CMO-HfOx ReRAM. The heatmap provides insight into the distribution of programmed states for different target conductances, indicating the reliability and uniformity of the programming process. The closed-loop scheme, as depicted in the flowchart, aims to precisely control the conductance of the ReRAM by iteratively applying SET and RESET pulses and adjusting the voltage based on the measured conductance. The varying voltage values for different conductance ranges suggest an optimization strategy to achieve accurate and efficient programming. The acceptance range indicates a tolerance level for the programmed conductance, allowing for some variation while still achieving the desired functionality. The flowchart's iterative nature highlights the importance of feedback in achieving precise control over the ReRAM's resistive state.