\n
## Diagram: Information Issues & Related Topics
### Overview
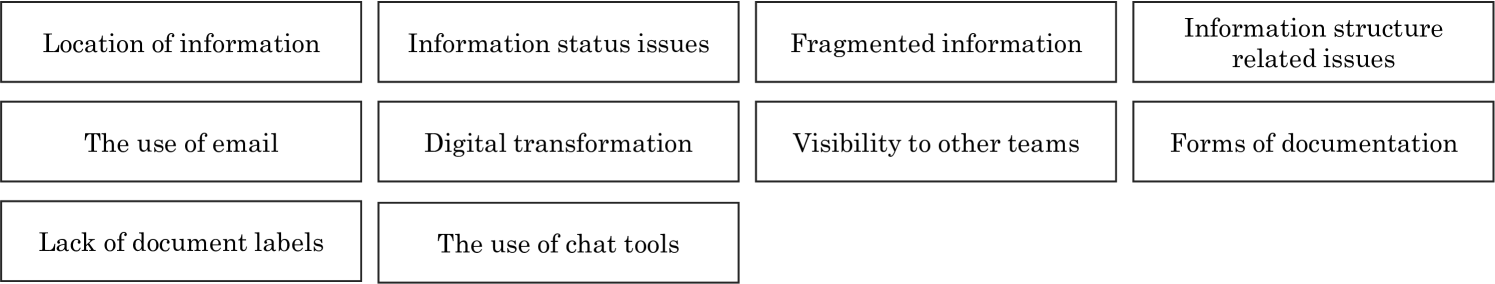
The image presents a grid-like arrangement of rectangular boxes, each containing a short phrase. It appears to be a visual representation of different categories or themes related to information management and related challenges within an organization. There is no explicit chart or graph structure, but rather a collection of labels.
### Components/Axes
The diagram consists of 12 rectangular boxes arranged in a 3x4 grid. There are no axes or scales present. The boxes contain the following labels:
* **Row 1:**
* Location of information
* Information status issues
* Fragmented information
* Information structure related issues
* **Row 2:**
* The use of email
* Digital transformation
* Visibility to other teams
* Forms of documentation
* **Row 3:**
* Lack of document labels
* The use of chat tools
### Detailed Analysis or Content Details
The content is purely textual, with each box containing a phrase. There are no numerical values or data points. The phrases suggest areas of concern or topics for discussion related to information management.
### Key Observations
The arrangement of the boxes doesn't suggest a specific order or hierarchy. The topics seem to fall into broad categories: information organization, communication methods, and broader organizational changes.
### Interpretation
This diagram likely represents a brainstorming output or a categorization of issues identified during an assessment of information management practices. The topics suggest challenges related to finding information ("Location of information"), understanding its current state ("Information status issues"), and ensuring it's accessible and consistent ("Fragmented information"). The inclusion of "The use of email" and "The use of chat tools" indicates a focus on communication channels and their impact on information flow. "Digital transformation" suggests a broader organizational context, and the mention of "Forms of documentation" and "Lack of document labels" highlights the importance of proper documentation practices. The diagram doesn't offer any quantitative data or relationships between the topics, but it provides a snapshot of areas requiring attention. It is a qualitative overview of potential problems.