## Resistance vs. Time Chart
### Overview
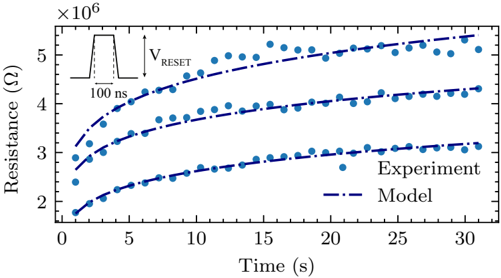
The image is a chart displaying the relationship between resistance (in Ohms) and time (in seconds). It shows three data series, each representing an experiment, along with corresponding model curves. An inset diagram illustrates the pulse shape used in the experiment.
### Components/Axes
* **X-axis:** Time (s), ranging from 0 to 30 seconds. Increments are marked at 5-second intervals.
* **Y-axis:** Resistance (Ω), scaled by a factor of 10^6. The axis ranges from 2 to 5, implying a resistance range of 2 x 10^6 Ω to 5 x 10^6 Ω. Increments are marked at intervals of 1 x 10^6 Ω.
* **Legend:** Located in the bottom-right corner.
* "Experiment": Represented by blue dots.
* "Model": Represented by a blue dashed-dotted line.
* **Inset Diagram:** Located in the top-left corner, showing a pulse shape with "V_RESET" indicating the voltage and "100 ns" indicating the pulse width.
### Detailed Analysis
There are three distinct data series plotted on the chart. Each series consists of blue dots representing experimental data and a corresponding blue dashed-dotted line representing the model.
* **Bottom Series:**
* **Experiment (Blue Dots):** Starts at approximately 1.8 x 10^6 Ω at time 0, increases rapidly initially, and then plateaus to approximately 3.1 x 10^6 Ω at 30 seconds.
* **Model (Blue Dashed-Dotted Line):** Follows a similar trend to the experimental data, starting at approximately 1.8 x 10^6 Ω and approaching 3.1 x 10^6 Ω at 30 seconds.
* **Middle Series:**
* **Experiment (Blue Dots):** Starts at approximately 2.8 x 10^6 Ω at time 0, increases rapidly initially, and then plateaus to approximately 4.3 x 10^6 Ω at 30 seconds.
* **Model (Blue Dashed-Dotted Line):** Follows a similar trend to the experimental data, starting at approximately 2.8 x 10^6 Ω and approaching 4.3 x 10^6 Ω at 30 seconds.
* **Top Series:**
* **Experiment (Blue Dots):** Starts at approximately 3.3 x 10^6 Ω at time 0, increases rapidly initially, and then plateaus to approximately 5.3 x 10^6 Ω at 30 seconds.
* **Model (Blue Dashed-Dotted Line):** Follows a similar trend to the experimental data, starting at approximately 3.3 x 10^6 Ω and approaching 5.3 x 10^6 Ω at 30 seconds.
### Key Observations
* All three data series exhibit a similar trend: a rapid increase in resistance during the initial phase (0-5 seconds), followed by a gradual plateauing as time increases.
* The "Model" curves closely match the "Experiment" data points for all three series, suggesting a good fit between the model and the experimental results.
* The inset diagram indicates that the experiment involves applying a voltage pulse (V_RESET) with a duration of 100 nanoseconds.
### Interpretation
The chart demonstrates the time-dependent behavior of resistance under certain experimental conditions, likely related to a material or device being subjected to voltage pulses. The close agreement between the experimental data and the model suggests that the model accurately captures the underlying physical processes governing the resistance change. The initial rapid increase in resistance could be attributed to a fast-acting mechanism, while the subsequent plateauing indicates a saturation effect or a slower, rate-limiting process. The different starting resistance values for the three series could represent different initial states or experimental parameters. The pulse shape and duration (V_RESET, 100 ns) are crucial parameters in understanding the experimental setup and the observed resistance behavior.