## LineGraph: Resistance vs. Time with Experimental and Model Data
### Overview
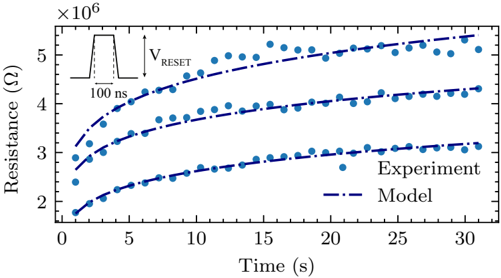
The image is a line graph depicting the relationship between resistance (in megaohms, Ω × 10⁶) and time (in seconds). It includes three data series: "Experiment" (dotted line), "Model" (dashed line), and another "Model" (solid line). A small inset diagram illustrates a voltage pulse with a labeled "V_RESET" and a 100 ns duration. The graph emphasizes the convergence of experimental and modeled resistance trends over time.
---
### Components/Axes
- **Y-axis**: "Resistance (Ω)" with a scale of 10⁶ (megaohms), ranging from 2 × 10⁶ to 5.5 × 10⁶ Ω.
- **X-axis**: "Time (s)", ranging from 0 to 30 seconds.
- **Legend**:
- "Experiment" (dotted line)
- "Model" (dashed line)
- "Model" (solid line) — *Note: The legend only explicitly lists two entries, but the graph contains three data series. This discrepancy may indicate an error in the legend or an unlabelled third model.*
- **Inset Diagram**: A voltage pulse with a rectangular waveform labeled "V_RESET" and a 100 ns duration.
---
### Detailed Analysis
1. **Experiment (Dotted Line)**:
- Starts at ~2.5 × 10⁶ Ω at 0 seconds.
- Increases gradually, reaching ~5 × 10⁶ Ω by 30 seconds.
- Shows minor fluctuations but follows a consistent upward trend.
2. **Model (Dashed Line)**:
- Starts at ~2 × 10⁶ Ω at 0 seconds.
- Increases steadily, aligning closely with the experimental data by 30 seconds.
- Slightly lags the experimental curve in the early stages (0–10 seconds).
3. **Model (Solid Line)**:
- Starts at ~3 × 10⁶ Ω at 0 seconds.
- Increases more rapidly than the dashed model, reaching ~5.5 × 10⁶ Ω by 30 seconds.
- Diverges significantly from the experimental and dashed model lines.
4. **Inset Diagram**:
- A voltage pulse with a sharp rise and fall, labeled "V_RESET" (likely the voltage threshold for resistance change).
- Duration of 100 ns (0.1 microseconds) is explicitly marked.
---
### Key Observations
- **Convergence of Experiment and Model**: The dashed "Model" line closely matches the experimental data, suggesting the model accurately predicts the observed resistance behavior.
- **Third Model (Solid Line)**: This line diverges from the experimental and dashed model, indicating either a different model configuration, experimental condition, or an error in the legend.
- **Voltage Pulse Context**: The inset suggests the resistance changes may be triggered by a short-duration voltage pulse (100 ns), possibly simulating a switching event.
---
### Interpretation
The graph demonstrates that resistance increases over time, likely due to a physical process (e.g., oxidation, material degradation, or electrical stress). The experimental data and the dashed model align well, validating the model's accuracy. The solid "Model" line, however, deviates significantly, raising questions about its parameters or the conditions under which it was derived. The inset's 100 ns voltage pulse implies the resistance changes may be transient or triggered by specific electrical stimuli. This could relate to applications like resistive memory devices, where voltage pulses induce state changes. The divergence of the solid model highlights the need for further validation or clarification of its assumptions.