## Histogram Comparison: Logit-Boost vs. Entropy Drop
### Overview
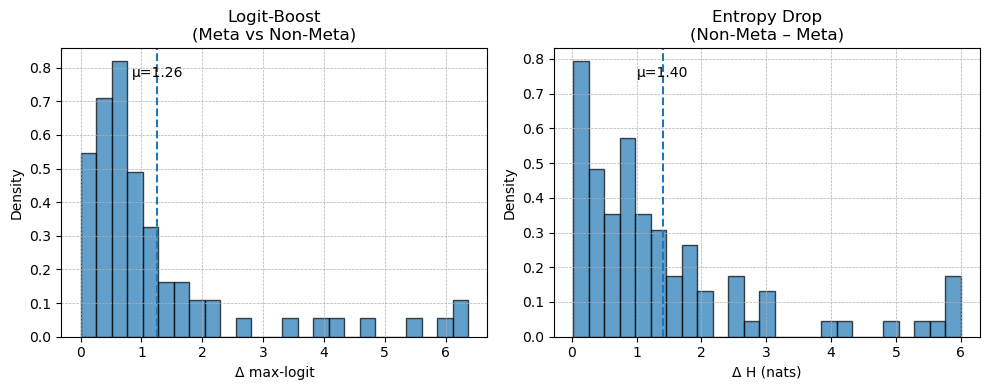
The image presents two histograms side-by-side, comparing the distributions of "Logit-Boost (Meta vs Non-Meta)" and "Entropy Drop (Non-Meta - Meta)". Both histograms display the density of data points against their respective x-axis values: "Δ max-logit" for Logit-Boost and "Δ H (nats)" for Entropy Drop. Both plots show a positive skew.
### Components/Axes
**Left Histogram: Logit-Boost (Meta vs Non-Meta)**
* **Title:** Logit-Boost (Meta vs Non-Meta)
* **Y-axis:** Density, ranging from 0.0 to 0.8 in increments of 0.1.
* **X-axis:** Δ max-logit, ranging from 0 to 6 in increments of 1.
* **Bars:** Blue, representing the frequency of data points within each bin.
* **Mean Line:** A vertical dashed blue line indicates the mean (μ) at 1.26.
**Right Histogram: Entropy Drop (Non-Meta - Meta)**
* **Title:** Entropy Drop (Non-Meta - Meta)
* **Y-axis:** Density, ranging from 0.0 to 0.8 in increments of 0.1.
* **X-axis:** Δ H (nats), ranging from 0 to 6 in increments of 1.
* **Bars:** Blue, representing the frequency of data points within each bin.
* **Mean Line:** A vertical dashed blue line indicates the mean (μ) at 1.40.
### Detailed Analysis
**Left Histogram: Logit-Boost (Meta vs Non-Meta)**
* **Trend:** The distribution is heavily skewed to the right. The highest density occurs between 0 and 1 Δ max-logit.
* **Data Points (Approximate):**
* 0-1: Density ~0.7
* 1-2: Density ~0.17
* 2-3: Density ~0.1
* 3-4: Density ~0.03
* 4-5: Density ~0.03
* 5-6: Density ~0.01
* 6-7: Density ~0.1
**Right Histogram: Entropy Drop (Non-Meta - Meta)**
* **Trend:** The distribution is skewed to the right. The highest density occurs between 0 and 1 Δ H (nats).
* **Data Points (Approximate):**
* 0-1: Density ~0.78
* 1-2: Density ~0.26
* 2-3: Density ~0.05
* 3-4: Density ~0.03
* 4-5: Density ~0.01
* 5-6: Density ~0.03
* 6-7: Density ~0.17
### Key Observations
* Both histograms exhibit a right-skewed distribution, indicating that most data points are concentrated at lower values of Δ max-logit and Δ H (nats).
* The mean value for Entropy Drop (1.40) is slightly higher than that for Logit-Boost (1.26).
* Both histograms show a small number of data points at higher values of the x-axis, creating a long tail.
### Interpretation
The histograms compare the distributions of Logit-Boost (Meta vs Non-Meta) and Entropy Drop (Non-Meta - Meta). The right-skewed distributions suggest that, in general, the difference between meta and non-meta values for both Logit-Boost and Entropy Drop tends to be small. The slightly higher mean for Entropy Drop indicates that, on average, the difference between non-meta and meta values is somewhat larger for Entropy Drop than for Logit-Boost. The long tails suggest that there are some instances where the difference between meta and non-meta values is significantly larger.