\n
## Histograms: Logit-Boost and Entropy Drop Comparison
### Overview
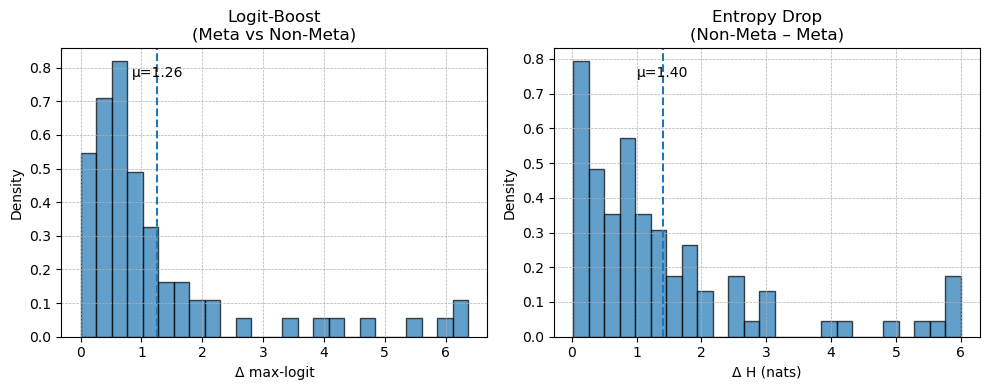
The image presents two histograms side-by-side, comparing the distributions of two metrics: "Logit-Boost (Meta vs Non-Meta)" and "Entropy Drop (Non-Meta - Meta)". Both histograms display density on the y-axis and a difference metric on the x-axis. Each histogram includes a vertical dashed line indicating the mean (μ) of the distribution.
### Components/Axes
* **Left Histogram:**
* **Title:** Logit-Boost (Meta vs Non-Meta)
* **X-axis Label:** Δ max-logit
* **Y-axis Label:** Density
* **Mean Indicator:** μ = 1.26 (represented by a dashed vertical line)
* **Right Histogram:**
* **Title:** Entropy Drop (Non-Meta - Meta)
* **X-axis Label:** Δ H (nats)
* **Y-axis Label:** Density
* **Mean Indicator:** μ = 1.40 (represented by a dashed vertical line)
* **Both Histograms:**
* **X-axis Scale:** Ranges from 0 to approximately 6.
* **Y-axis Scale:** Ranges from 0 to approximately 0.8.
* **Grid:** A light gray grid is present in the background of both histograms.
### Detailed Analysis or Content Details
**Left Histogram (Logit-Boost):**
The histogram shows a distribution that is heavily skewed to the right. The highest density is observed between 0 and 1. The density decreases as the Δ max-logit value increases.
* Approximate bin values and densities (reading from left to right):
* 0-0.5: Density ≈ 0.75
* 0.5-1: Density ≈ 0.6
* 1-1.5: Density ≈ 0.35
* 1.5-2: Density ≈ 0.2
* 2-2.5: Density ≈ 0.12
* 2.5-3: Density ≈ 0.08
* 3-3.5: Density ≈ 0.06
* 3.5-4: Density ≈ 0.04
* 4-4.5: Density ≈ 0.03
* 4.5-5: Density ≈ 0.02
* 5-5.5: Density ≈ 0.015
* 5.5-6: Density ≈ 0.01
**Right Histogram (Entropy Drop):**
This histogram also exhibits a right-skewed distribution, but it appears slightly less skewed than the Logit-Boost histogram. The peak density is also around 0-1, but the distribution is more spread out.
* Approximate bin values and densities (reading from left to right):
* 0-0.5: Density ≈ 0.7
* 0.5-1: Density ≈ 0.65
* 1-1.5: Density ≈ 0.4
* 1.5-2: Density ≈ 0.25
* 2-2.5: Density ≈ 0.15
* 2.5-3: Density ≈ 0.1
* 3-3.5: Density ≈ 0.07
* 3.5-4: Density ≈ 0.05
* 4-4.5: Density ≈ 0.03
* 4.5-5: Density ≈ 0.02
* 5-5.5: Density ≈ 0.01
* 5.5-6: Density ≈ 0.01
### Key Observations
* Both distributions are right-skewed, indicating that most of the differences (Δ max-logit and Δ H) are relatively small, with a few larger differences.
* The mean of the Entropy Drop distribution (μ = 1.40) is slightly higher than the mean of the Logit-Boost distribution (μ = 1.26), suggesting that, on average, the entropy drop is larger than the logit-boost difference.
* The Logit-Boost histogram has a sharper peak and a more rapid decline in density compared to the Entropy Drop histogram.
### Interpretation
The image compares the differences between "Meta" and "Non-Meta" approaches using two different metrics: Logit-Boost and Entropy Drop. The histograms reveal that both metrics generally show small differences between the two approaches, but there is a range of variation. The right skewness suggests that the "Meta" approach sometimes leads to significantly larger improvements (or differences) in both Logit-Boost and Entropy Drop, but these cases are less frequent.
The slightly higher mean for Entropy Drop suggests that the "Meta" approach tends to have a greater impact on entropy reduction than on logit-boosting, on average. The difference in the shape of the distributions could indicate that the Logit-Boost metric is more sensitive to small changes or that the underlying process generating the Logit-Boost differences is more concentrated around a smaller range of values.
These visualizations are useful for understanding the distribution of performance differences between the "Meta" and "Non-Meta" approaches and for identifying potential areas where the "Meta" approach provides the most significant benefits.