## Histograms: Logit-Boost and Entropy Drop Comparisons
### Overview
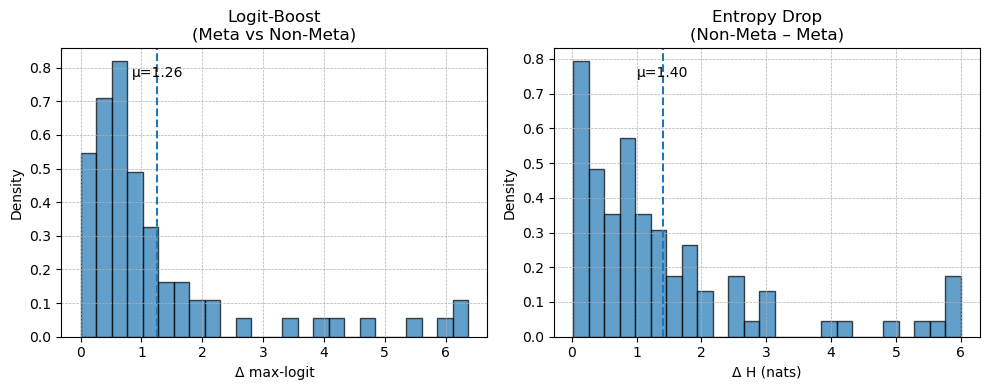
The image contains two side-by-side histograms comparing distributions of performance metrics between "Meta" and "Non-Meta" approaches. The left histogram focuses on **Logit-Boost**, while the right examines **Entropy Drop**. Both use density as the y-axis and a delta metric on the x-axis, with vertical dashed lines indicating mean values (μ).
### Components/Axes
1. **Left Histogram (Logit-Boost: Meta vs Non-Meta)**
- **X-axis**: Δ max-logit (range: 0–6)
- **Y-axis**: Density (range: 0–0.8)
- **Legend**: "Meta vs Non-Meta" (textual, no color coding)
- **Mean (μ)**: 1.26 (dashed blue line)
2. **Right Histogram (Entropy Drop: Non-Meta - Meta)**
- **X-axis**: Δ H (nats) (range: 0–6)
- **Y-axis**: Density (range: 0–0.8)
- **Legend**: "Non-Meta - Meta" (textual, no color coding)
- **Mean (μ)**: 1.40 (dashed blue line)
### Detailed Analysis
#### Logit-Boost (Meta vs Non-Meta)
- **Distribution**:
- Highest density (~0.8) at Δ max-logit = 0.
- Density decreases sharply for Δ max-logit > 1, with minimal values beyond 2.
- Mean (μ = 1.26) aligns with the peak density at 0, suggesting most data clusters near the lower end of the scale.
#### Entropy Drop (Non-Meta - Meta)
- **Distribution**:
- Highest density (~0.8) at Δ H = 0.
- Density declines gradually, with a secondary peak (~0.3) at Δ H ≈ 1.
- Mean (μ = 1.40) is higher than Logit-Boost, indicating a broader spread of values.
- Notable tail extending to Δ H = 6, with sparse but visible density (~0.1).
### Key Observations
1. **Concentration vs Spread**:
- Logit-Boost shows a tightly concentrated distribution (peak at 0, rapid decline).
- Entropy Drop exhibits a broader distribution, with a secondary peak and extended tail.
2. **Mean Differences**:
- Logit-Boost mean (1.26) is lower than Entropy Drop (1.40), suggesting Non-Meta - Meta introduces larger average deviations.
3. **Performance Implications**:
- Logit-Boost’s sharp decline implies more consistent performance across Meta/Non-Meta.
- Entropy Drop’s spread and higher mean may indicate instability or variability in Non-Meta - Meta comparisons.
### Interpretation
The histograms highlight trade-offs between the two approaches:
- **Logit-Boost** prioritizes consistency, with most data near the optimal (Δ max-logit = 0).
- **Entropy Drop** shows greater variability, potentially reflecting sensitivity to differences between Meta and Non-Meta.
- The higher mean in Entropy Drop (1.40 vs. 1.26) suggests Non-Meta - Meta comparisons are more divergent, possibly due to model complexity or data distribution shifts.
These patterns could inform model selection: Logit-Boost may be preferable for stable performance, while Entropy Drop’s spread might require further investigation into its limitations.