## Line Chart: NDCG@10% vs. Dimensions
### Overview
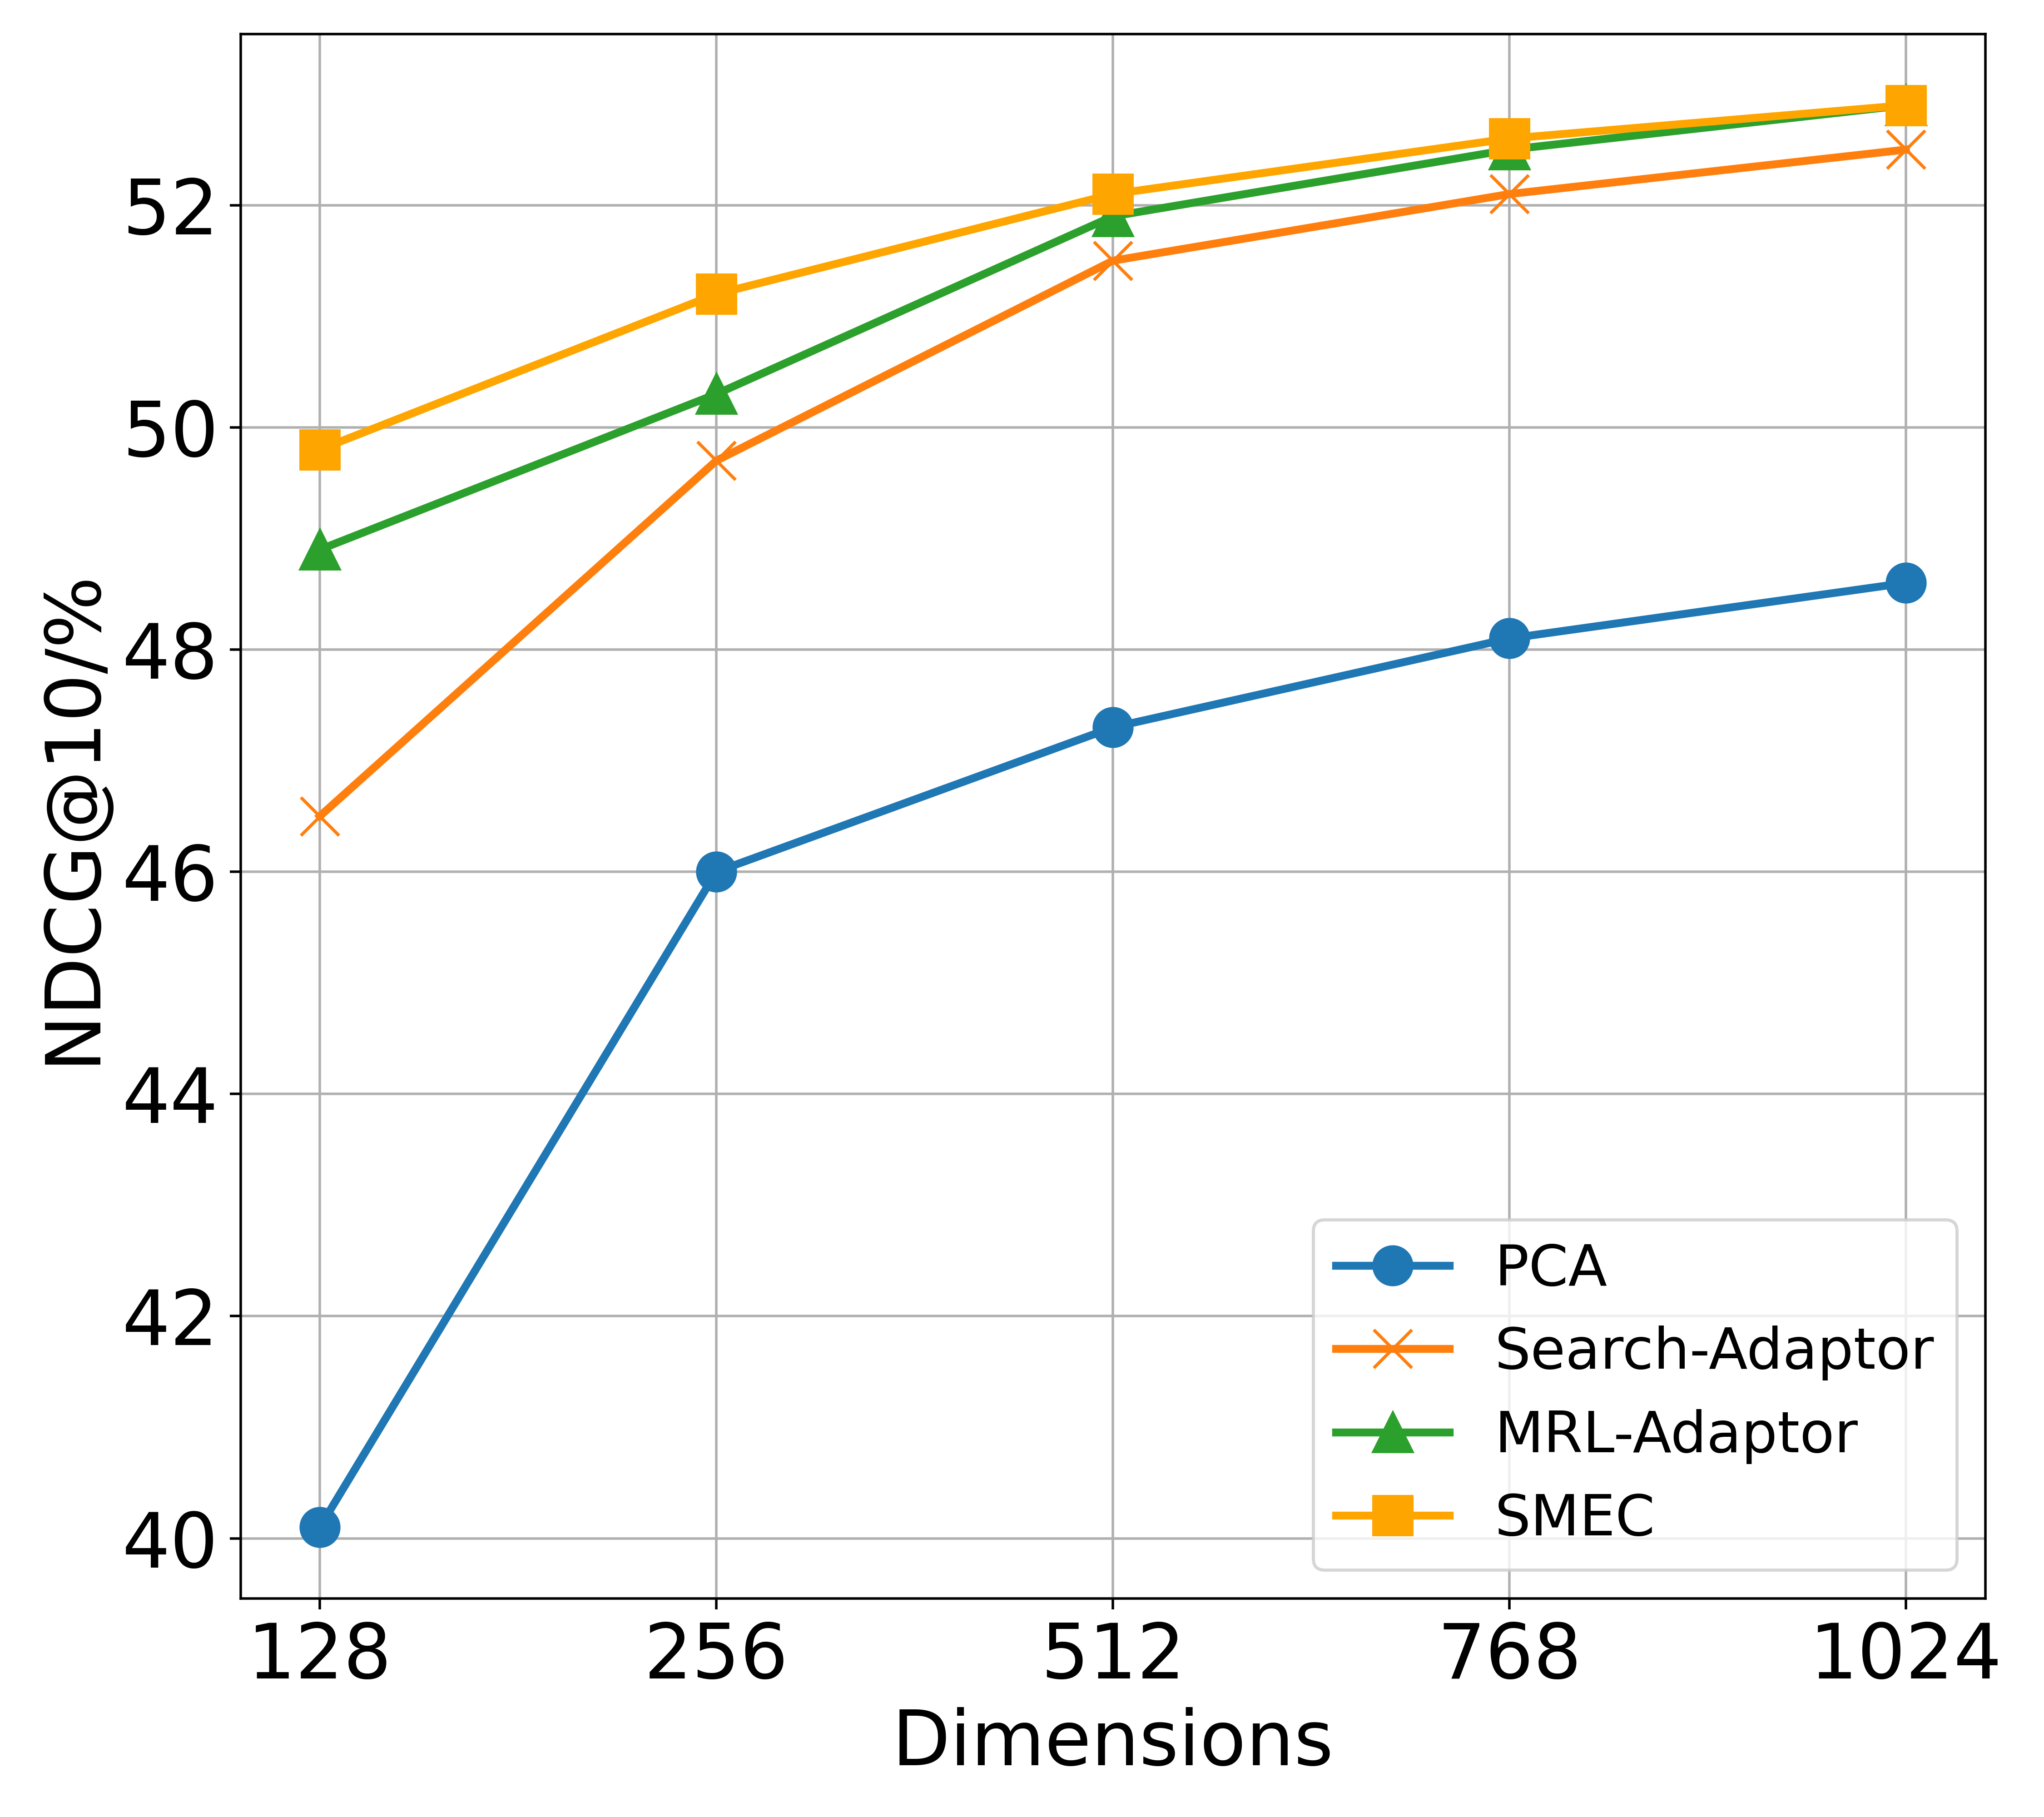
This image presents a line chart comparing the performance of four different methods (PCA, Search-Adaptor, MRL-Adaptor, and SMEC) across varying dimensions. The performance metric is NDCG@10%, plotted against dimensions ranging from 128 to 1024.
### Components/Axes
* **X-axis:** Dimensions, with markers at 128, 256, 512, 768, and 1024.
* **Y-axis:** NDCG@10%, ranging from approximately 40 to 53.
* **Legend:** Located in the top-right corner, identifying the four data series:
* PCA (Blue circle)
* Search-Adaptor (Orange cross)
* MRL-Adaptor (Green triangle)
* SMEC (Yellow square)
* **Gridlines:** Present to aid in reading values.
### Detailed Analysis
Let's analyze each line individually:
* **PCA (Blue):** This line starts at approximately 40 at 128 dimensions, increases sharply to around 45 at 256 dimensions, continues to rise more gradually to approximately 47 at 512 dimensions, then plateaus around 48-49 for 768 and 1024 dimensions.
* **Search-Adaptor (Orange):** This line begins at approximately 49 at 128 dimensions, rises to around 50 at 256 dimensions, then increases steadily to approximately 52 at 512 dimensions, and continues to around 53 at 768 and 1024 dimensions.
* **MRL-Adaptor (Green):** This line starts at approximately 49.5 at 128 dimensions, increases to around 51 at 256 dimensions, then rises to approximately 52.5 at 512 dimensions, and plateaus around 53 for 768 and 1024 dimensions.
* **SMEC (Yellow):** This line begins at approximately 51 at 128 dimensions, rises to around 52 at 256 dimensions, then increases to approximately 53 at 512 dimensions, and remains stable at around 53 for 768 and 1024 dimensions.
Here's a table summarizing the approximate data points:
| Dimensions | PCA (NDCG@10%) | Search-Adaptor (NDCG@10%) | MRL-Adaptor (NDCG@10%) | SMEC (NDCG@10%) |
|---|---|---|---|---|
| 128 | 40 | 49 | 49.5 | 51 |
| 256 | 45 | 50 | 51 | 52 |
| 512 | 47 | 52 | 52.5 | 53 |
| 768 | 48 | 53 | 53 | 53 |
| 1024 | 49 | 53 | 53 | 53 |
### Key Observations
* SMEC and MRL-Adaptor consistently outperform PCA across all dimensions.
* Search-Adaptor performs better than PCA, but generally lags behind SMEC and MRL-Adaptor.
* The performance of all methods appears to plateau after 512 dimensions, with diminishing returns from increasing dimensionality further.
* PCA shows the most significant initial improvement with increasing dimensions, but its growth slows down considerably.
### Interpretation
The chart demonstrates the impact of dimensionality on the performance of different methods for a specific task (likely information retrieval or ranking, given the NDCG metric). The NDCG@10% metric indicates the normalized discounted cumulative gain at rank 10, measuring the ranking quality of the top 10 results.
The plateauing effect observed after 512 dimensions suggests that increasing the dimensionality beyond this point does not significantly improve performance, and may even introduce noise or computational overhead. SMEC and MRL-Adaptor's consistently high performance indicates their effectiveness in capturing relevant information even in high-dimensional spaces. PCA, while showing initial gains, appears to be limited in its ability to represent the data effectively at higher dimensions.
The differences in performance between the methods likely stem from their underlying approaches to dimensionality reduction and feature representation. SMEC and MRL-Adaptor may employ more sophisticated techniques that better preserve the relevant information during dimensionality reduction, leading to superior ranking performance. The chart suggests that for this particular task, a dimensionality of around 512 strikes a good balance between performance and computational cost.