\n
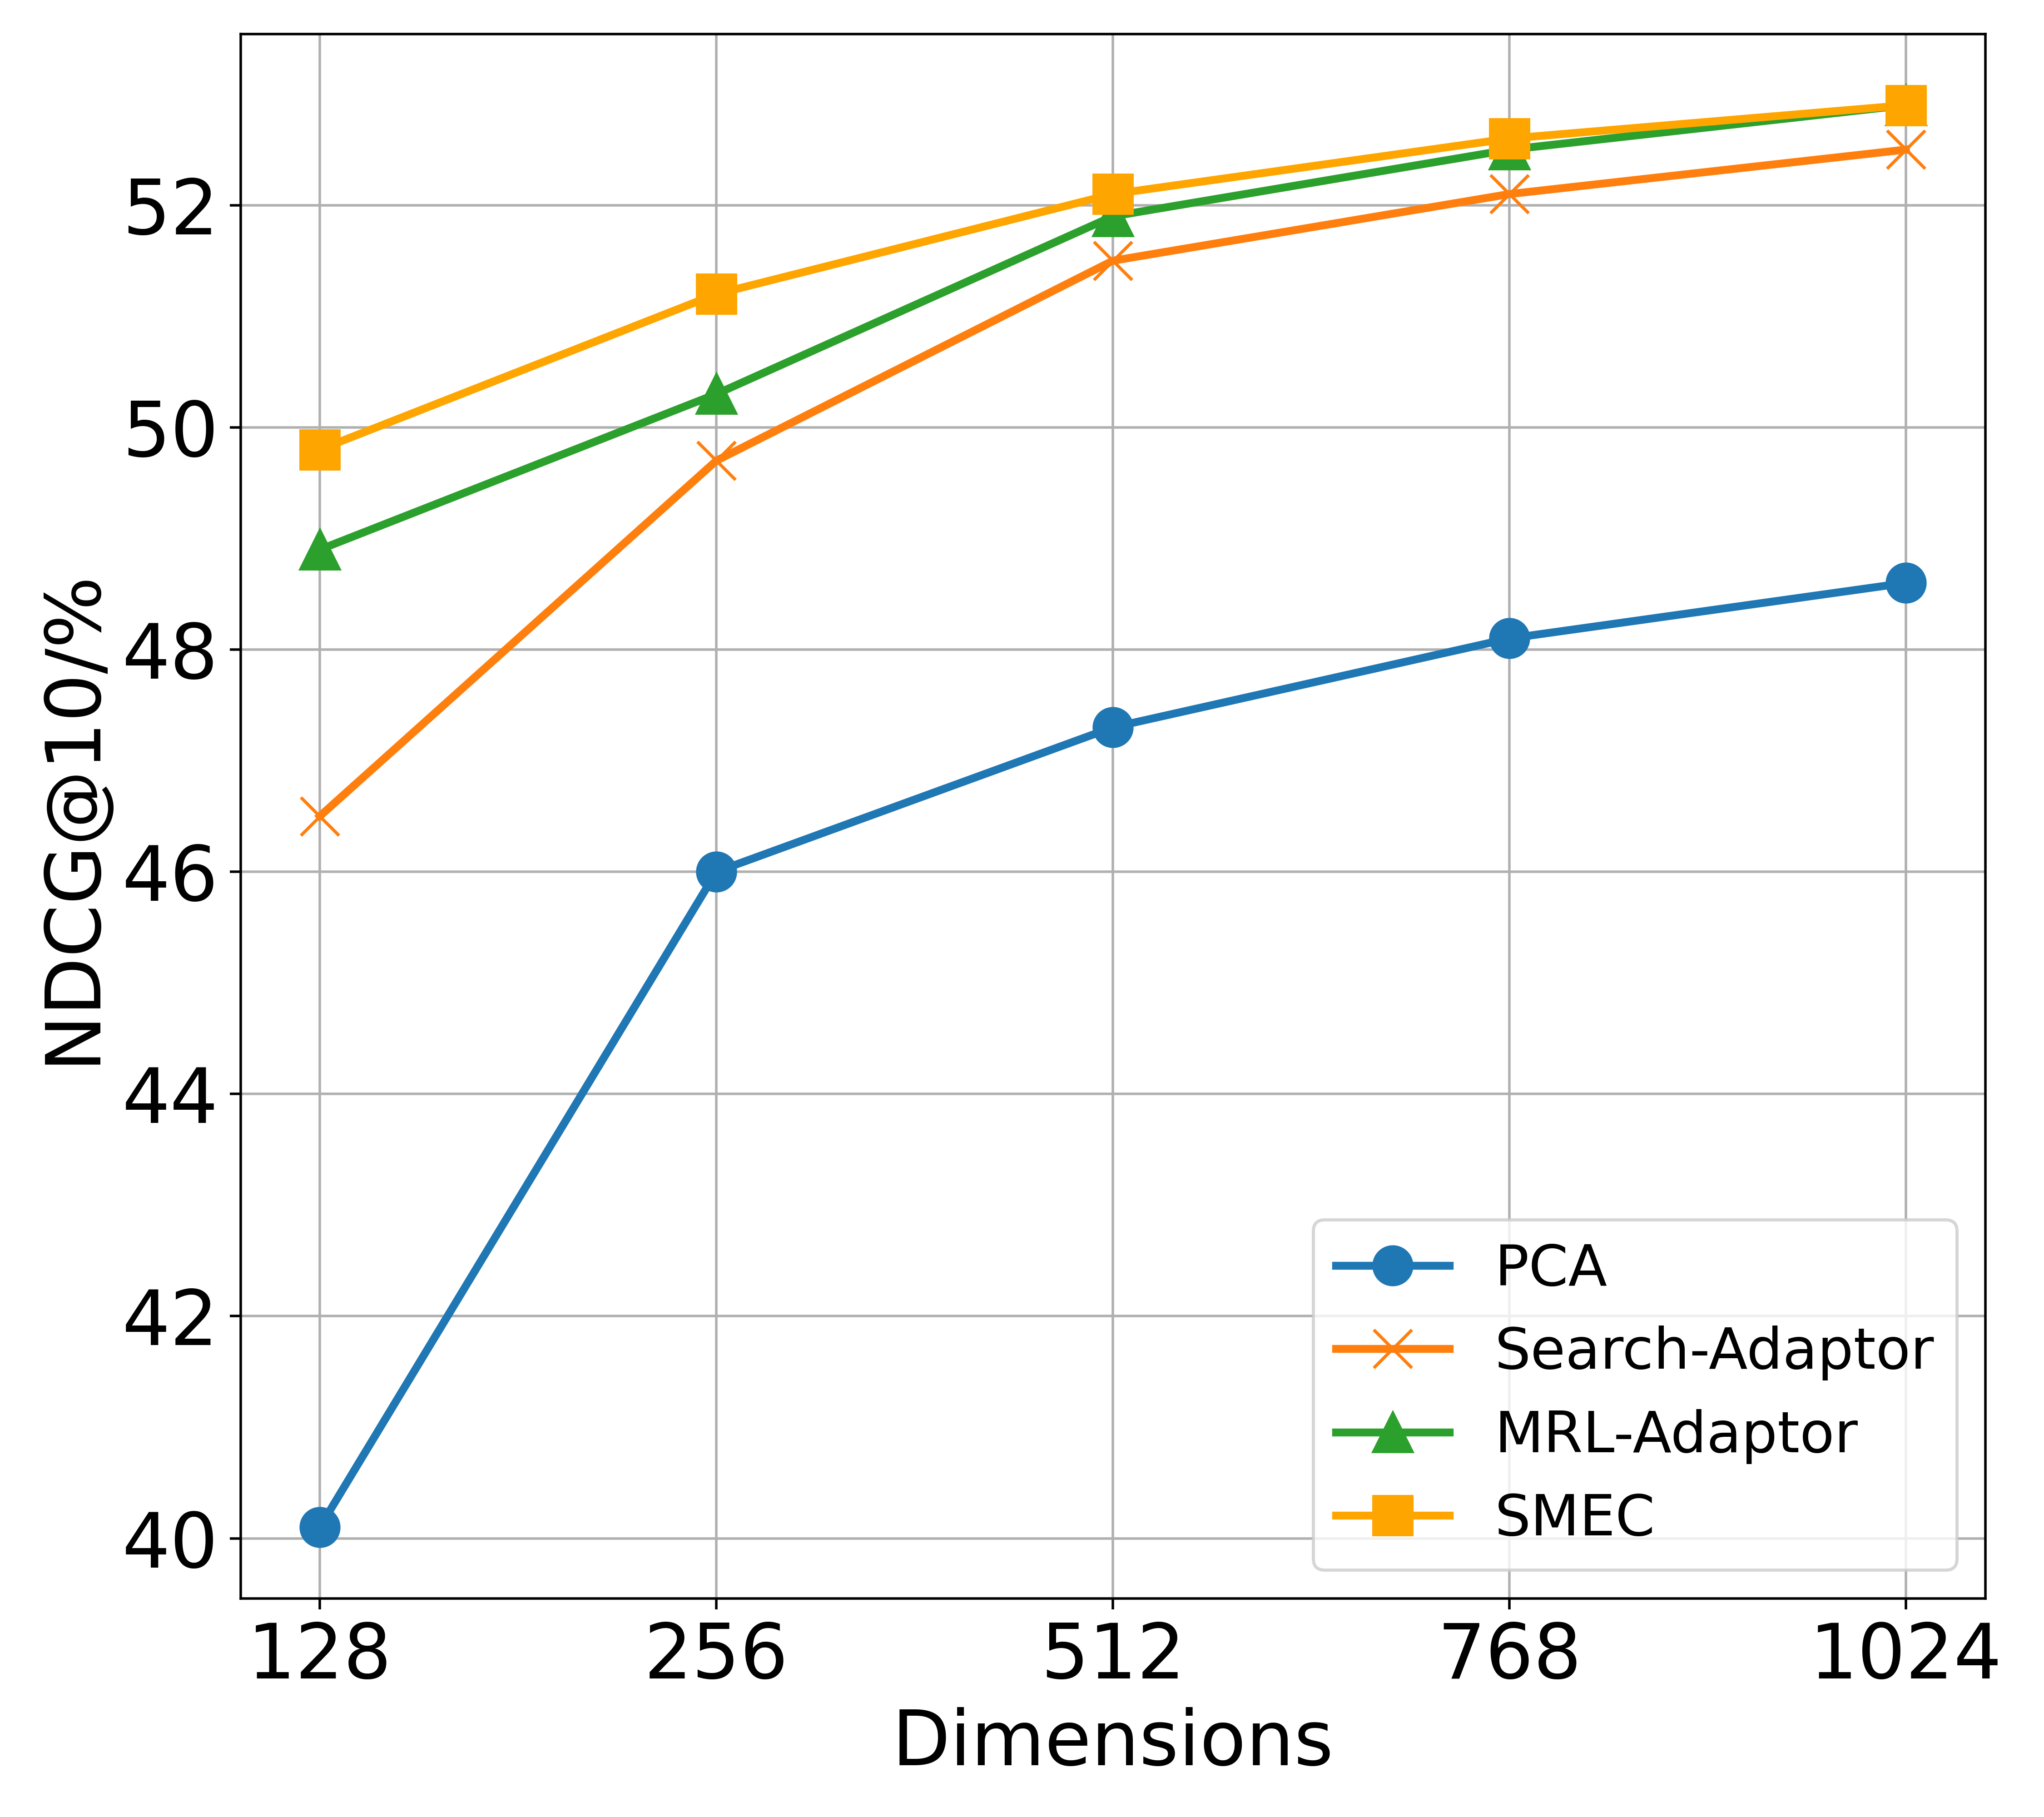
## Line Chart: Performance Comparison of Dimensionality Reduction Methods
### Overview
The image is a line chart comparing the performance of four different dimensionality reduction or adaptation methods across varying embedding dimensions. The performance metric is NDCG@10 (Normalized Discounted Cumulative Gain at rank 10), expressed as a percentage. The chart demonstrates how each method's effectiveness changes as the dimensionality of the representation increases.
### Components/Axes
* **X-Axis (Horizontal):** Labeled "Dimensions". It represents the dimensionality of the embedding space. The axis has five discrete, evenly spaced tick marks at values: **128, 256, 512, 768, 1024**.
* **Y-Axis (Vertical):** Labeled "NDCG@10/%". It represents the retrieval performance metric. The axis ranges from **40 to 52**, with major grid lines at intervals of 2 (40, 42, 44, 46, 48, 50, 52).
* **Legend:** Located in the **bottom-right corner** of the chart area. It contains four entries, each associating a line color and marker style with a method name:
* **Blue line with circle markers (●):** PCA
* **Orange line with 'x' markers (×):** Search-Adaptor
* **Green line with triangle markers (▲):** MRL-Adaptor
* **Yellow line with square markers (■):** SMEC
### Detailed Analysis
All four data series show a positive, monotonic trend: performance (NDCG@10) increases as the number of dimensions increases. The rate of improvement generally slows down at higher dimensions, suggesting diminishing returns.
**Data Series and Approximate Values:**
1. **PCA (Blue, ●):**
* **Trend:** Starts as the lowest-performing method and shows the most dramatic relative improvement, especially between 128 and 256 dimensions. The slope is steep initially and then becomes more gradual.
* **Data Points (Approximate):**
* 128 Dimensions: ~40.1%
* 256 Dimensions: ~46.0%
* 512 Dimensions: ~47.3%
* 768 Dimensions: ~48.1%
* 1024 Dimensions: ~48.6%
2. **Search-Adaptor (Orange, ×):**
* **Trend:** Starts significantly above PCA. Shows steady improvement, with a consistent upward slope that is less steep than PCA's initial jump.
* **Data Points (Approximate):**
* 128 Dimensions: ~46.5%
* 256 Dimensions: ~49.7%
* 512 Dimensions: ~51.5%
* 768 Dimensions: ~52.1%
* 1024 Dimensions: ~52.5%
3. **MRL-Adaptor (Green, ▲):**
* **Trend:** Starts as the second-highest method. Its performance line runs very close to, but consistently slightly below, the SMEC line. The gap between them narrows at higher dimensions.
* **Data Points (Approximate):**
* 128 Dimensions: ~48.9%
* 256 Dimensions: ~50.3%
* 512 Dimensions: ~51.9%
* 768 Dimensions: ~52.5%
* 1024 Dimensions: ~52.9%
4. **SMEC (Yellow, ■):**
* **Trend:** The top-performing method across all measured dimensions. It maintains a small but consistent lead over MRL-Adaptor.
* **Data Points (Approximate):**
* 128 Dimensions: ~49.8%
* 256 Dimensions: ~51.2%
* 512 Dimensions: ~52.1%
* 768 Dimensions: ~52.7%
* 1024 Dimensions: ~53.0%
### Key Observations
* **Performance Hierarchy:** A clear and consistent hierarchy is maintained across all dimensions: **SMEC > MRL-Adaptor > Search-Adaptor > PCA**.
* **Convergence at High Dimensions:** The performance gap between the top two methods (SMEC and MRL-Adaptor) and between the middle two (Search-Adaptor and MRL-Adaptor) becomes very small at 768 and 1024 dimensions. The lines for SMEC and MRL-Adaptor nearly converge at 1024 dimensions.
* **PCA's Lag:** PCA consistently underperforms the other three specialized adaptation methods by a significant margin (approximately 3-9 percentage points), though it does benefit from increased dimensionality.
* **Diminishing Returns:** All curves show a concave shape, indicating that the gain in NDCG@10 from doubling the dimensions decreases as the dimensions get larger. The most significant gains for all methods occur between 128 and 512 dimensions.
### Interpretation
This chart provides strong evidence for two key conclusions in the context of representation learning for retrieval tasks:
1. **Specialized Adaptation Outperforms Generic Reduction:** Methods designed specifically for the search/retrieval task (Search-Adaptor, MRL-Adaptor, SMEC) dramatically outperform a generic dimensionality reduction technique (PCA). This suggests that simply compressing vectors is insufficient; the adaptation must be tailored to preserve or enhance the properties needed for effective ranking.
2. **Higher Dimensionality is Beneficial, but with Limits:** Increasing the dimensionality of the embedding space consistently improves retrieval performance for all methods. However, the flattening curves suggest a practical ceiling. The cost (computational, storage) of moving from 512 to 1024 dimensions yields a smaller performance benefit than moving from 128 to 256. The optimal dimensionality likely involves a trade-off between performance and efficiency, with 512 or 768 appearing as potential sweet spots where performance is high and the rate of improvement begins to plateau.
3. **SMEC and MRL-Adaptor are State-of-the-Art:** The near-identical performance of SMEC and MRL-Adaptor at high dimensions indicates they are both highly effective approaches. The choice between them might depend on other factors not shown here, such as training stability, inference speed, or performance on other metrics. SMEC's slight edge at lower dimensions (128, 256) could be meaningful in resource-constrained scenarios.