## Line Chart: NDCG@10/% vs Dimensions
### Overview
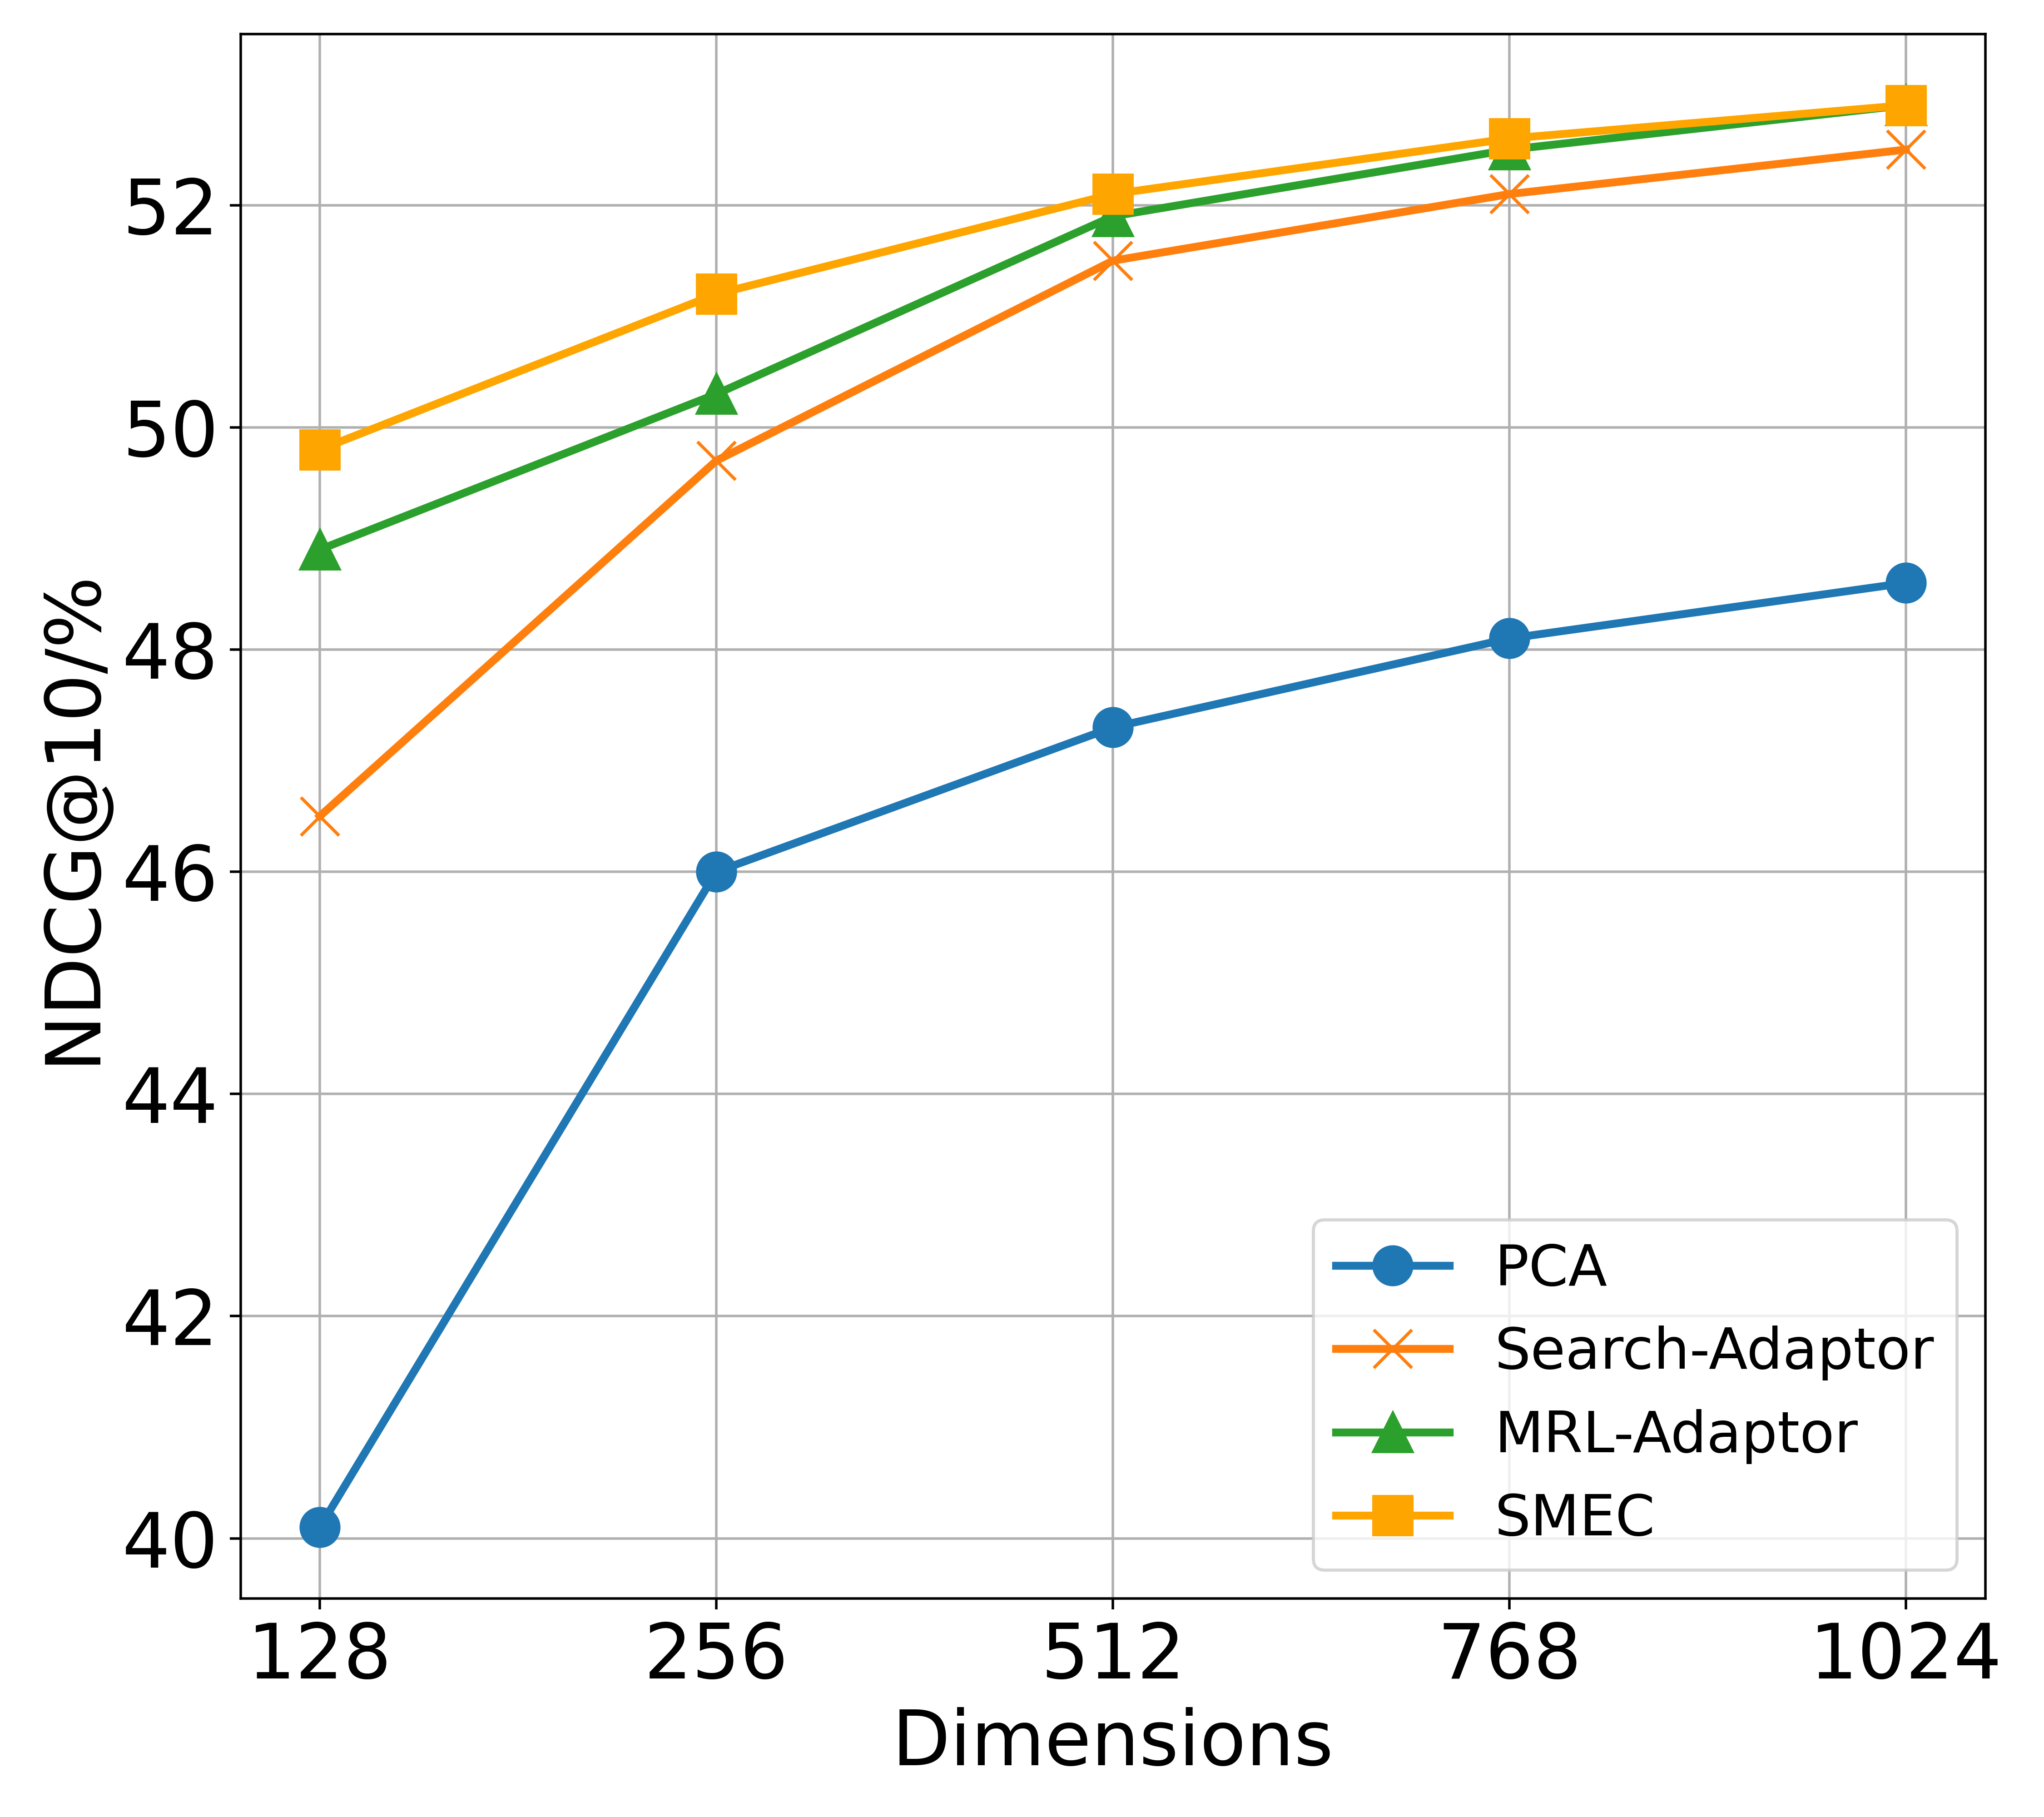
The chart illustrates the performance of four different methods (PCA, Search-Adaptor, MRL-Adaptor, SMEC) in terms of NDCG@10/% across varying dimensions (128, 256, 512, 768, 1024). Each method is represented by a distinct line with unique markers and colors, showing how their performance evolves as the number of dimensions increases.
### Components/Axes
- **X-axis (Dimensions)**: Labeled "Dimensions" with discrete values: 128, 256, 512, 768, 1024.
- **Y-axis (NDCG@10/%**: Labeled "NDCG@10/%" with a range from 40 to 52.
- **Legend**: Located in the bottom-right corner, mapping:
- **Blue circles**: PCA
- **Orange crosses**: Search-Adaptor
- **Green triangles**: MRL-Adaptor
- **Yellow squares**: SMEC
### Detailed Analysis
1. **PCA (Blue Circles)**:
- Starts at **40%** at 128 dimensions.
- Increases steadily to **46%** at 256, **47.5%** at 512, **48%** at 768, and **48.5%** at 1024.
- **Trend**: Gradual upward slope with minimal acceleration.
2. **Search-Adaptor (Orange Crosses)**:
- Begins at **46.5%** at 128 dimensions.
- Rises sharply to **49.5%** at 256, **51.5%** at 512, **52%** at 768, and **52.5%** at 1024.
- **Trend**: Steep initial increase, then plateaus slightly.
3. **MRL-Adaptor (Green Triangles)**:
- Starts at **49%** at 128 dimensions.
- Increases to **50.5%** at 256, **51.8%** at 512, **52.2%** at 768, and **52.5%** at 1024.
- **Trend**: Consistent upward trajectory with moderate growth.
4. **SMEC (Yellow Squares)**:
- Begins at **50%** at 128 dimensions.
- Rises to **51%** at 256, **52%** at 512, **52.5%** at 768, and **53%** at 1024.
- **Trend**: Steady linear increase with minimal fluctuation.
### Key Observations
- **PCA** consistently underperforms compared to other methods, showing the slowest growth.
- **Search-Adaptor** and **MRL-Adaptor** exhibit similar performance, with Search-Adaptor slightly outperforming at higher dimensions.
- **SMEC** maintains the highest performance across all dimensions, with a slight edge over MRL-Adaptor at 1024.
- All methods show improvement as dimensions increase, but the rate of improvement varies.
### Interpretation
The data suggests that increasing the number of dimensions generally enhances NDCG@10/% performance for all methods. However, **SMEC** and **MRL-Adaptor** demonstrate superior scalability, achieving higher scores even at lower dimensions. **PCA** lags behind, indicating it may not be as effective for this task. The sharp rise of **Search-Adaptor** at lower dimensions suggests it is particularly sensitive to dimensionality changes, potentially making it a strong candidate for scenarios where dimensionality is constrained. The plateau in Search-Adaptor’s growth at higher dimensions implies diminishing returns beyond a certain point. This chart highlights the trade-offs between computational complexity (dimensions) and performance gains, guiding method selection based on specific use cases.