## Diagram: Taxonomy of Process Reward Models (PRMs)
### Overview
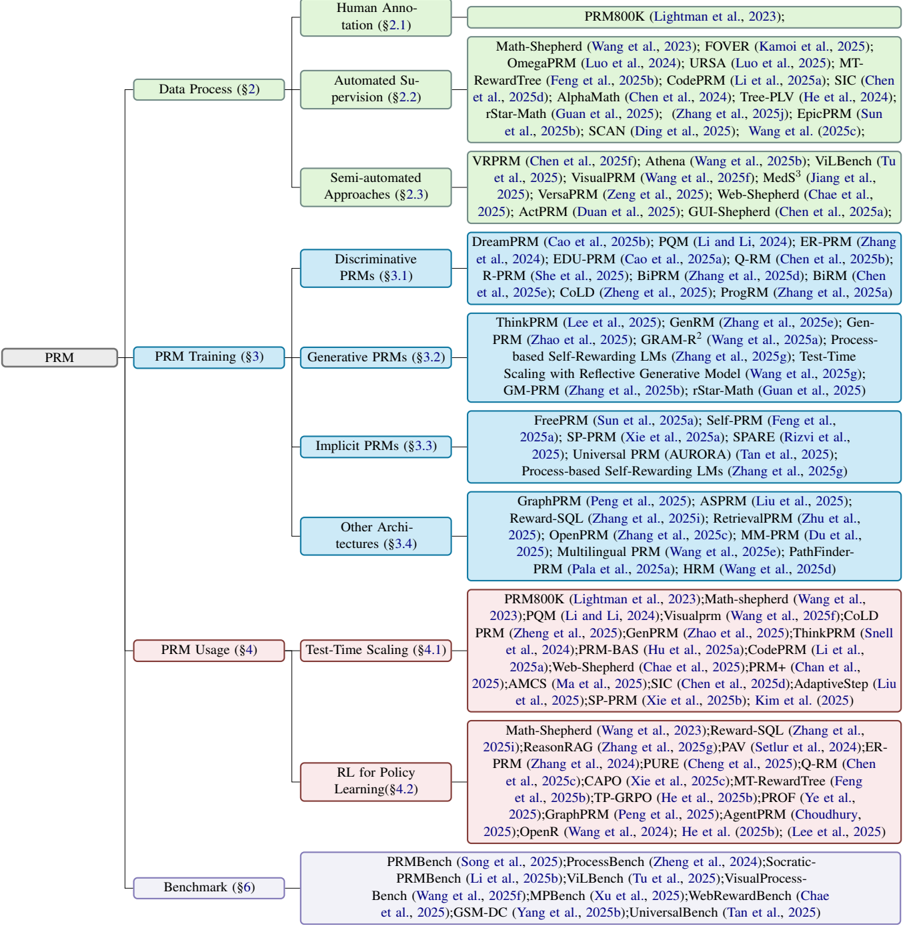
The image is a hierarchical taxonomy diagram (tree structure) classifying research and methods related to Process Reward Models (PRMs). The diagram is organized from a central root node "PRM" which branches into four primary categories: Data Process, PRM Training, PRM Usage, and Benchmark. Each primary category further subdivides into specific approaches or sub-fields, with each leaf node listing numerous associated research papers and their citations. The diagram uses color-coding: primary categories are in light green boxes, subcategories are in light blue boxes, and the lists of associated papers/references are in light red boxes.
### Components/Axes
* **Root Node:** "PRM" (center-left).
* **Primary Categories (Green Boxes):**
* Data Process (§2)
* PRM Training (§3)
* PRM Usage (§4)
* Benchmark (§6)
* **Subcategories (Blue Boxes):** Branch from their respective primary category.
* From Data Process: Human Annotation (§2.1), Automated Supervision (§2.2), Semi-automated Approaches (§2.3).
* From PRM Training: Discriminative PRMs (§3.1), Generative PRMs (§3.2), Implicit PRMs (§3.3), Other Architectures (§3.4).
* From PRM Usage: Test-Time Scaling (§4.1), RL for Policy Learning (§4.2).
* **Reference Lists (Red Boxes):** Each subcategory box is connected to a corresponding red box containing a list of research papers. The connection is a straight line from the right side of the blue subcategory box to the left side of the red reference box.
* **Spatial Layout:** The tree flows from left to right. The root is on the far left. Primary categories are stacked vertically to its right. Subcategories are stacked vertically to the right of their parent category. Reference lists are aligned vertically to the far right, each adjacent to its parent subcategory.
### Detailed Analysis
**1. Data Process (§2)**
* **Human Annotation (§2.1):** Associated with `PRM800K (Lightman et al., 2023)`.
* **Automated Supervision (§2.2):** Associated with a long list of methods including Math-Shepherd, FOVER, OmegaPRM, URSA, MT-RewardTree, CodePRM, SIC, AlphaMath, Tree-PLV, rStar-Math, SCAN, and Wang et al. (2025c).
* **Semi-automated Approaches (§2.3):** Associated with VRPRM, Athena, ViLBench, VisualPRM, MedS³, VersaPRM, Web-Shepherd, ActPRM, and GUI-Shepherd.
**2. PRM Training (§3)**
* **Discriminative PRMs (§3.1):** Associated with DreamPRM, PQM, ER-PRM, EDU-PRM, Q-RM, R-PRM, BiPRM, BiRM, CoLD, and ProgRM.
* **Generative PRMs (§3.2):** Associated with ThinkPRM, GenRM, GRAM-R², Process-based Self-Rewarding LMs, Test-Time Scaling with Reflective Generative Model, GM-PRM, and rStar-Math.
* **Implicit PRMs (§3.3):** Associated with FreePRM, Self-PRM, SP-PRM, SPARE, Universal PRM (AURORA), and Process-based Self-Rewarding LMs.
* **Other Architectures (§3.4):** Associated with GraphPRM, ASPRM, Reward-SQL, RetrievalPRM, OpenPRM, MM-PRM, Multilingual PRM, Pathfinder-PRM, and HRM.
**3. PRM Usage (§4)**
* **Test-Time Scaling (§4.1):** Associated with a dense list including PRM800K, Math-shepherd, PQM, VisualPRM, CoLD PRM, GenPRM, ThinkPRM, PRM-BAS, CodePRM, Web-Shepherd, PRM+, AMCS, SIC, AdaptiveStep, SP-PRM, and Kim et al. (2025).
* **RL for Policy Learning (§4.2):** Associated with Math-Shepherd, Reward-SQL, ReasonRAG, PAV, ER-PRM, PURE, Q-RM, CAPO, MT-RewardTree, TP-GRPO, PROF, GraphPRM, AgentPRM, OpenR, He et al. (2024), and Lee et al. (2025).
**4. Benchmark (§6)**
* This primary category has no further subcategories. It connects directly to a single red box listing benchmark works: PRMBench, ProcessBench, Socratic-PRMBench, ViLBench, VisualProcessing-Bench, MPBench, WebRewardBench, GSM-DC, and UniversalBench.
### Key Observations
* **Research Density:** The "PRM Training" and "PRM Usage" sections contain the most numerous and densely packed subcategories and references, indicating these are the most active areas of research.
* **Methodological Evolution:** The "Data Process" section shows a clear progression from pure human annotation (§2.1) to automated (§2.2) and hybrid (§2.3) methods.
* **Architectural Diversity:** The "PRM Training" section highlights a split between discriminative (§3.1) and generative (§3.2) approaches, with additional categories for implicit models and other novel architectures.
* **Application Focus:** The "PRM Usage" section is explicitly divided between using PRMs for scaling at inference time (§4.1) and for reinforcement learning to improve policies (§4.2).
* **Citation Patterns:** Many papers appear in multiple sections (e.g., `Math-Shepherd` appears under Data Process, PRM Usage, and RL for Policy Learning), indicating foundational or multi-faceted work. The year range is predominantly 2023-2025, showing this is a very current and rapidly evolving field.
### Interpretation
This taxonomy provides a structured map of the Process Reward Model research landscape as of early 2025. It demonstrates that the field has moved beyond simple human-labeled data (§2.1) to develop sophisticated automated and semi-automated techniques for generating process supervision signals. The core technical challenge is reflected in the diverse training paradigms (§3), where researchers are exploring not just traditional discriminative models but also generative and implicit reward models, suggesting a search for more scalable and flexible architectures.
The "Usage" section (§4) reveals the two primary *purposes* of PRMs: to improve the reasoning of language models during inference (test-time scaling) and to serve as a reward signal for training better policies via RL. The extensive list of benchmarks (§6) underscores the community's focus on rigorous evaluation. Overall, the diagram illustrates a maturing research area that is systematically building the tools (data, models), applications (scaling, RL), and evaluation frameworks (benchmarks) necessary to use process-based rewards to enhance the reasoning capabilities of AI systems. The high density of 2024-2025 citations signals a period of intense innovation and publication.