## Flowchart: Process Stages in a Technical System
### Overview
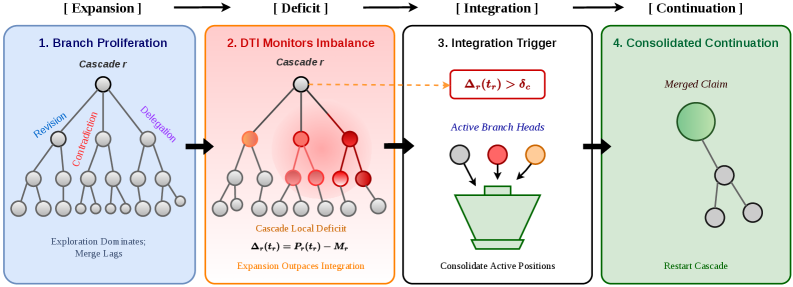
The image depicts a four-stage process flow diagram titled **"[Expansion] → [Deficit] → [Integration] → [Continuation]"**, illustrating a hierarchical decision-making or system monitoring workflow. Each stage contains a labeled diagram with nodes, arrows, and textual annotations. The flow progresses linearly from left to right, with each stage feeding into the next.
---
### Components/Axes
#### Stage 1: Branch Proliferation
- **Title**: "1. Branch Proliferation" (blue box)
- **Diagram**:
- A central node labeled **"Cascade r"** branches into three sub-nodes:
- **Revision** (left)
- **Contradiction** (center)
- **Delegation** (right)
- Sub-nodes further branch into smaller nodes.
- **Text**:
- "Exploration Dominates; Merge Lags" (bottom)
- Arrows labeled **"Revision"**, **"Contradiction"**, and **"Delegation"** connect nodes.
#### Stage 2: DTI Monitors Imbalance
- **Title**: "2. DTI Monitors Imbalance" (red box)
- **Diagram**:
- A central node labeled **"Cascade r"** branches into three sub-nodes:
- **Active Branch Heads** (highlighted in red)
- Two gray nodes (inactive branches)
- Arrows labeled **"Cascade Local Deficit"** point to sub-nodes.
- **Text**:
- "Cascade Local Deficit: Δ<sub>r</sub>(t<sub>r</sub>) = P<sub>r</sub>(t<sub>r</sub>) – M<sub>r</sub>" (center)
- "Expansion Outpaces Integration" (bottom)
#### Stage 3: Integration Trigger
- **Title**: "3. Integration Trigger" (black box)
- **Diagram**:
- A funnel-like structure labeled **"Consolidate Active Positions"**.
- Three colored nodes (red, orange, gray) feed into the funnel.
- A red box highlights **"Δ<sub>r</sub>(t<sub>r</sub>) > δ<sub>c</sub>"** (threshold condition).
- **Text**:
- "Active Branch Heads" (top)
- "Consolidate Active Positions" (bottom)
#### Stage 4: Consolidated Continuation
- **Title**: "4. Consolidated Continuation" (green box)
- **Diagram**:
- A merged node labeled **"Merged Claim"**.
- Two gray sub-nodes branch from the merged node.
- **Text**:
- "Restart Cascade" (bottom)
---
### Detailed Analysis
#### Stage 1: Branch Proliferation
- **Nodes**: Hierarchical expansion from a single root ("Cascade r") into three primary branches (Revision, Contradiction, Delegation), each further subdivided.
- **Key Text**: "Exploration Dominates; Merge Lags" suggests prioritization of exploration over integration at this stage.
#### Stage 2: DTI Monitors Imbalance
- **Nodes**: Central node ("Cascade r") with active (red) and inactive (gray) branches.
- **Key Text**:
- "Cascade Local Deficit" formula: Δ<sub>r</sub>(t<sub>r</sub>) = P<sub>r</sub>(t<sub>r</sub>) – M<sub>r</sub> (likely measures discrepancy between production and monitoring).
- "Expansion Outpaces Integration" implies imbalance between growth and consolidation.
#### Stage 3: Integration Trigger
- **Nodes**: Funnel structure consolidating active branches (red/orange nodes) into a single output.
- **Key Text**:
- Threshold condition: Δ<sub>r</sub>(t<sub>r</sub>) > δ<sub>c</sub> (triggers integration when deficit exceeds a critical value δ<sub>c</sub>).
#### Stage 4: Consolidated Continuation
- **Nodes**: Single merged node ("Merged Claim") with two sub-nodes, indicating streamlined output.
- **Key Text**: "Restart Cascade" implies cyclical re-initiation of the process.
---
### Key Observations
1. **Sequential Flow**: The process cycles through Expansion → Deficit → Integration → Continuation, with each stage dependent on the prior.
2. **Color Coding**:
- Red nodes in Stage 2 highlight active branches.
- Gray nodes represent inactive or merged branches.
3. **Threshold Logic**: Integration is triggered only when the deficit (Δ<sub>r</sub>) exceeds a critical value (δ<sub>c</sub>).
4. **Cyclical Nature**: The final stage ("Restart Cascade") suggests the process repeats iteratively.
---
### Interpretation
This flowchart models a **feedback-driven system** where:
1. **Expansion** prioritizes exploration (e.g., generating hypotheses or data branches).
2. **Deficit Monitoring** identifies imbalances between exploration and integration (via Δ<sub>r</sub>).
3. **Integration** consolidates active components only when deficits surpass a threshold, preventing premature merging.
4. **Continuation** restarts the cycle, enabling adaptive refinement.
The system likely applies to **machine learning**, **scientific research**, or **decision-making frameworks**, where balancing exploration and exploitation is critical. The use of "Cascade" terminology suggests hierarchical or tree-like structures (e.g., neural networks, knowledge graphs). The threshold δ<sub>c</sub> acts as a safeguard against premature integration, ensuring robustness.