\n
## Diagram: Access Control Timelines
### Overview
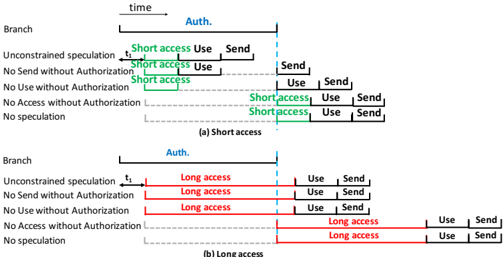
The image presents two diagrams illustrating access control timelines for "Short access" and "Long access" scenarios. Both diagrams depict time progressing from left to right, with horizontal lines representing different branches or conditions related to authorization and access. The diagrams use colored bars to indicate the duration of different stages: "Auth.", "access", "Use", and "Send".
### Components/Axes
* **X-axis:** Represents time, labeled at the top as "time".
* **Y-axis:** Represents different branches or conditions, labeled on the left as:
* Branch
* Unconstrained speculation
* No Send without Authorization
* No Use without Authorization
* No Access without Authorization
* No speculation
* **Color Coding:**
* Blue: "Auth." (Authorization)
* Green: "Short access"
* Red: "Long access"
* Black: "Use"
* Orange: "Send"
* **Labels:**
* "t₁" - A time marker on the x-axis.
* "(a) Short access" - Title for the first diagram.
* "(b) Long access" - Title for the second diagram.
### Detailed Analysis or Content Details
**Diagram (a) - Short Access**
* **Auth. (Blue):** Starts at time 0 and extends to approximately the same point as the start of "Short access".
* **Short access (Green):** Begins immediately after "Auth." and lasts for a relatively short duration, ending before any "Use" or "Send" actions occur in the upper branches. The duration is approximately 1/4 of the total timeline length.
* **Use (Black):** Appears in the upper branches after "Short access" and lasts for a short duration.
* **Send (Orange):** Appears in the upper branches after "Use" and lasts for a short duration.
* In the lower branches, "Short access" occurs later in time, and is followed by "Use" and "Send" actions.
**Diagram (b) - Long Access**
* **Auth. (Blue):** Starts at time 0 and extends to approximately the same point as the start of "Long access".
* **Long access (Red):** Begins immediately after "Auth." and lasts for a significantly longer duration than "Short access" in diagram (a), extending almost to the end of the timeline. The duration is approximately 3/4 of the total timeline length.
* **Use (Black):** Appears in the upper branches after "Long access" and lasts for a short duration.
* **Send (Orange):** Appears in the upper branches after "Use" and lasts for a short duration.
* In the lower branches, "Long access" occurs later in time, and is followed by "Use" and "Send" actions.
### Key Observations
* The primary difference between the two diagrams is the duration of the "access" phase. "Short access" is brief, while "Long access" is extended.
* The "Auth." phase appears to have a consistent duration in both diagrams.
* The "Use" and "Send" phases occur after the "access" phase in both diagrams, but their timing relative to the "access" phase differs significantly.
* The lower branches in both diagrams show a delayed "access" phase compared to the upper branches.
### Interpretation
These diagrams illustrate different access control scenarios, likely within a security protocol. The "Short access" scenario suggests a quick, limited-duration authorization, perhaps for a single operation. The "Long access" scenario suggests a sustained authorization, potentially for a session or ongoing activity.
The branching in the diagrams represents different conditions or policies. The upper branches likely represent scenarios where access is granted without restrictions, while the lower branches represent scenarios where access is subject to additional constraints (e.g., no sending data without authorization).
The diagrams highlight the importance of timing in access control. The duration of the "access" phase determines how long an entity is authorized to perform certain actions. The delayed "access" in the lower branches suggests that additional checks or approvals are required before access is granted under those conditions.
The diagrams are conceptual and do not provide specific numerical values for the durations of the different phases. However, they effectively communicate the relative timing and relationships between the different stages of the access control process. The diagrams are likely used to explain the behavior of a system or protocol to developers or security professionals.