# Technical Diagram Analysis
## Diagram Structure
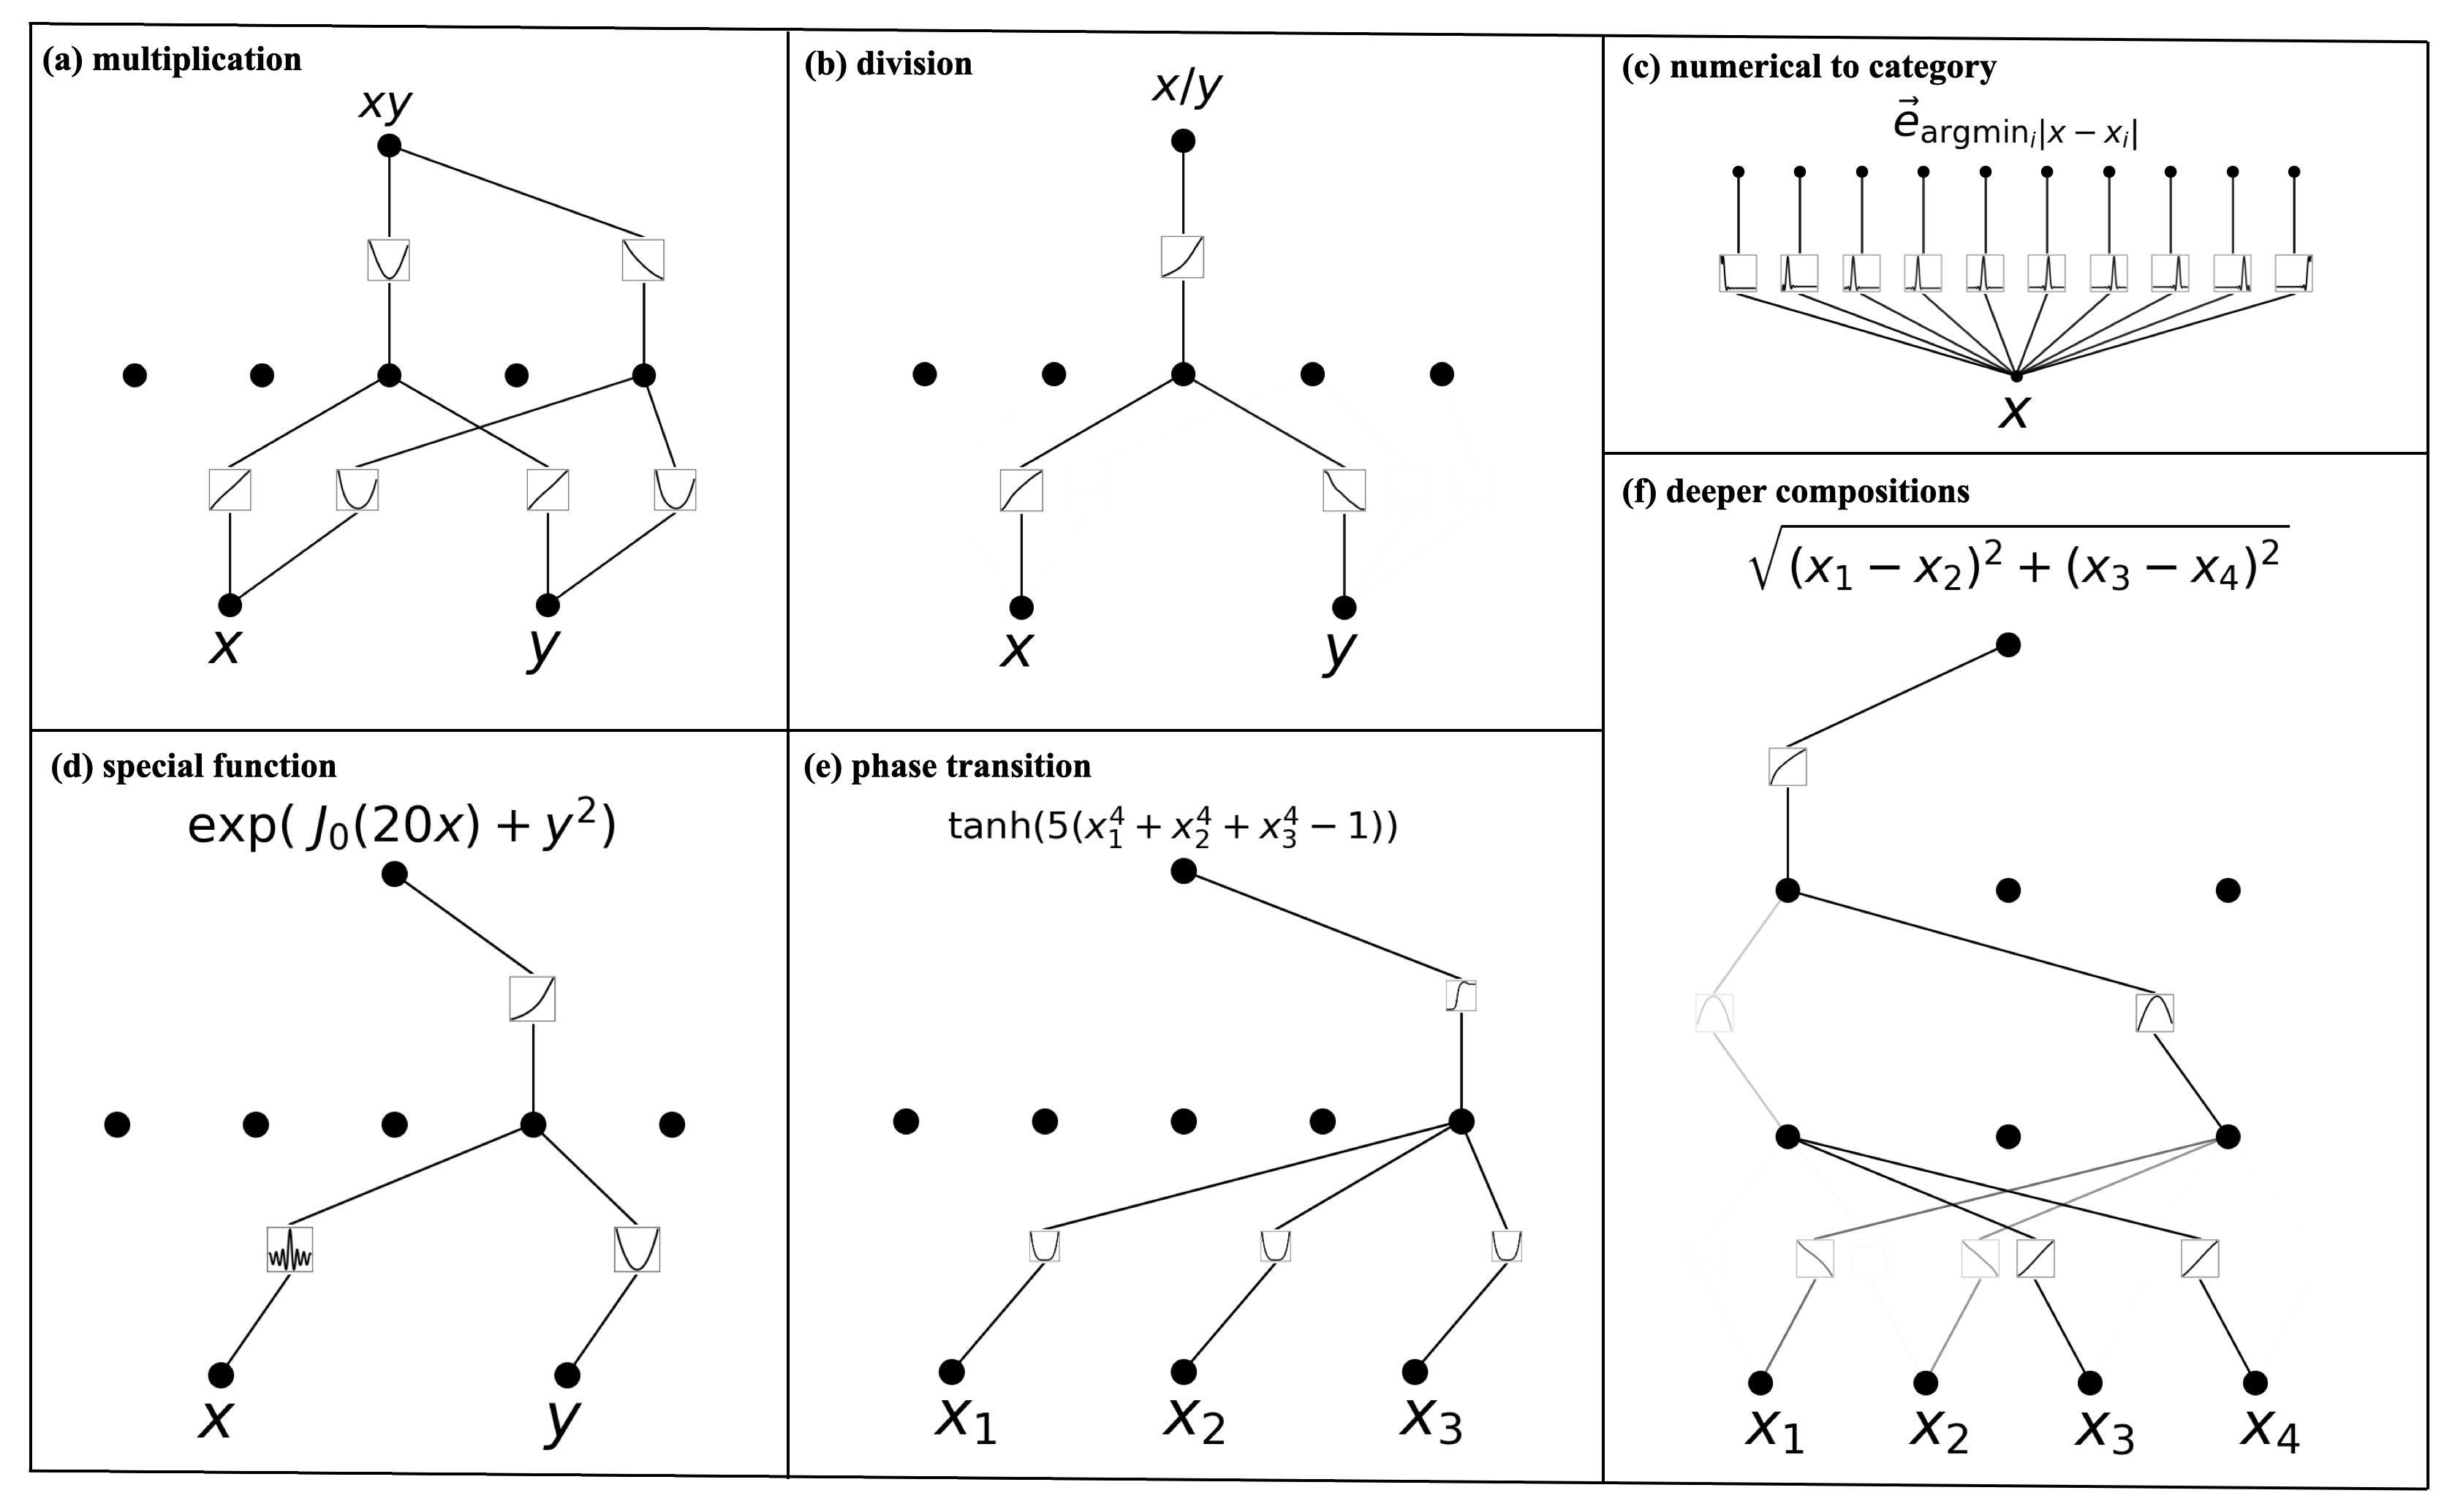
The image contains a 2x3 grid of technical diagrams with mathematical notation and symbolic representations. Each diagram is labeled with a specific operation or function type.
---
### Diagram (a): Multiplication
**Title:** (a) multiplication
**Nodes:**
- Input nodes: `x`, `y` (represented as black dots)
- Output node: `xy` (represented as a black dot with a cross)
**Connections:**
- Direct edges between `x` and `y`
- Crossed edges between `x` and `xy`, `y` and `xy`
**Mathematical Representation:**
`xy` (implied multiplication)
---
### Diagram (b): Division
**Title:** (b) division
**Nodes:**
- Input nodes: `x`, `y` (black dots)
- Output node: `x/y` (black dot with cross)
**Connections:**
- Direct edges between `x` and `y`
- Crossed edges between `x` and `x/y`, `y` and `x/y`
**Mathematical Representation:**
`x/y`
---
### Diagram (c): Numerical to Category
**Title:** (c) numerical to category
**Nodes:**
- Input node: `X` (black dot)
- Output nodes: `e_{argmin_i|x - x_i|}` (multiple nodes with arrows)
**Connections:**
- Single input node `X` connected to multiple output nodes via arrows
**Mathematical Representation:**
`e_{argmin_i|x - x_i|}` (vector notation)
---
### Diagram (d): Special Function
**Title:** (d) special function
**Nodes:**
- Input nodes: `x`, `y` (black dots)
- Function node: `exp(J₀(20x) + y²)` (black dot with cross)
**Connections:**
- Direct edges between `x` and `y`
- Crossed edges between `x` and function node, `y` and function node
**Mathematical Representation:**
`exp(J₀(20x) + y²)`
---
### Diagram (e): Phase Transition
**Title:** (e) phase transition
**Nodes:**
- Input nodes: `X₁`, `X₂`, `X₃` (black dots)
- Function node: `tanh(5(x₁⁴ + x₂⁴ + x₃⁴ - 1))` (black dot with cross)
**Connections:**
- Direct edges between `X₁`, `X₂`, `X₃`
- Crossed edges between input nodes and function node
**Mathematical Representation:**
`tanh(5(x₁⁴ + x₂⁴ + x₃⁴ - 1))`
---
### Diagram (f): Deeper Compositions
**Title:** (f) deeper compositions
**Nodes:**
- Input nodes: `X₁`, `X₂`, `X₃`, `X₄` (black dots)
- Function node: `√((x₁ - x₂)² + (x₃ - x₄)²)` (black dot with cross)
**Connections:**
- Complex network with multiple crossed edges
- Hierarchical connections between input nodes and function node
**Mathematical Representation:**
`√((x₁ - x₂)² + (x₃ - x₄)²)`
---
## Key Observations
1. **Symbolic Representation:**
- Black dots represent input variables
- Crossed dots represent function outputs
- Arrows indicate directional relationships
2. **Mathematical Operations:**
- Basic arithmetic (multiplication/division)
- Special functions (exponential, hyperbolic tangent)
- Composition of functions with multiple variables
3. **Architectural Patterns:**
- Feedforward structures in (a)-(e)
- Hierarchical composition in (f)
- Vectorized operations in (c)
4. **Notation Consistency:**
- Subscript notation for categorical outputs (`argmin_i`)
- Superscript notation for variable powers (`x₁⁴`)
- Square root symbol for compositional functions
---
## Technical Implications
These diagrams appear to represent:
1. **Neural Network Architectures**
- Feedforward structures in (a)-(e)
- Compositional layers in (f)
2. **Mathematical Function Approximation**
- Use of special functions (Bessel function `J₀`, hyperbolic tangent)
- Composition of operations for complex transformations
3. **Categorical Mapping**
- Numerical-to-categorical conversion in (c)
- Distance-based assignment (`argmin_i|x - x_i|`)
---
## Limitations
- No explicit data values or numerical results provided
- No color-coded data series or heatmaps present
- No temporal or sequential dimensions represented
---
## Language Analysis
All text is in English. No non-English content detected.