## Chart: Model Accuracy Across Mathematical Tasks
### Overview
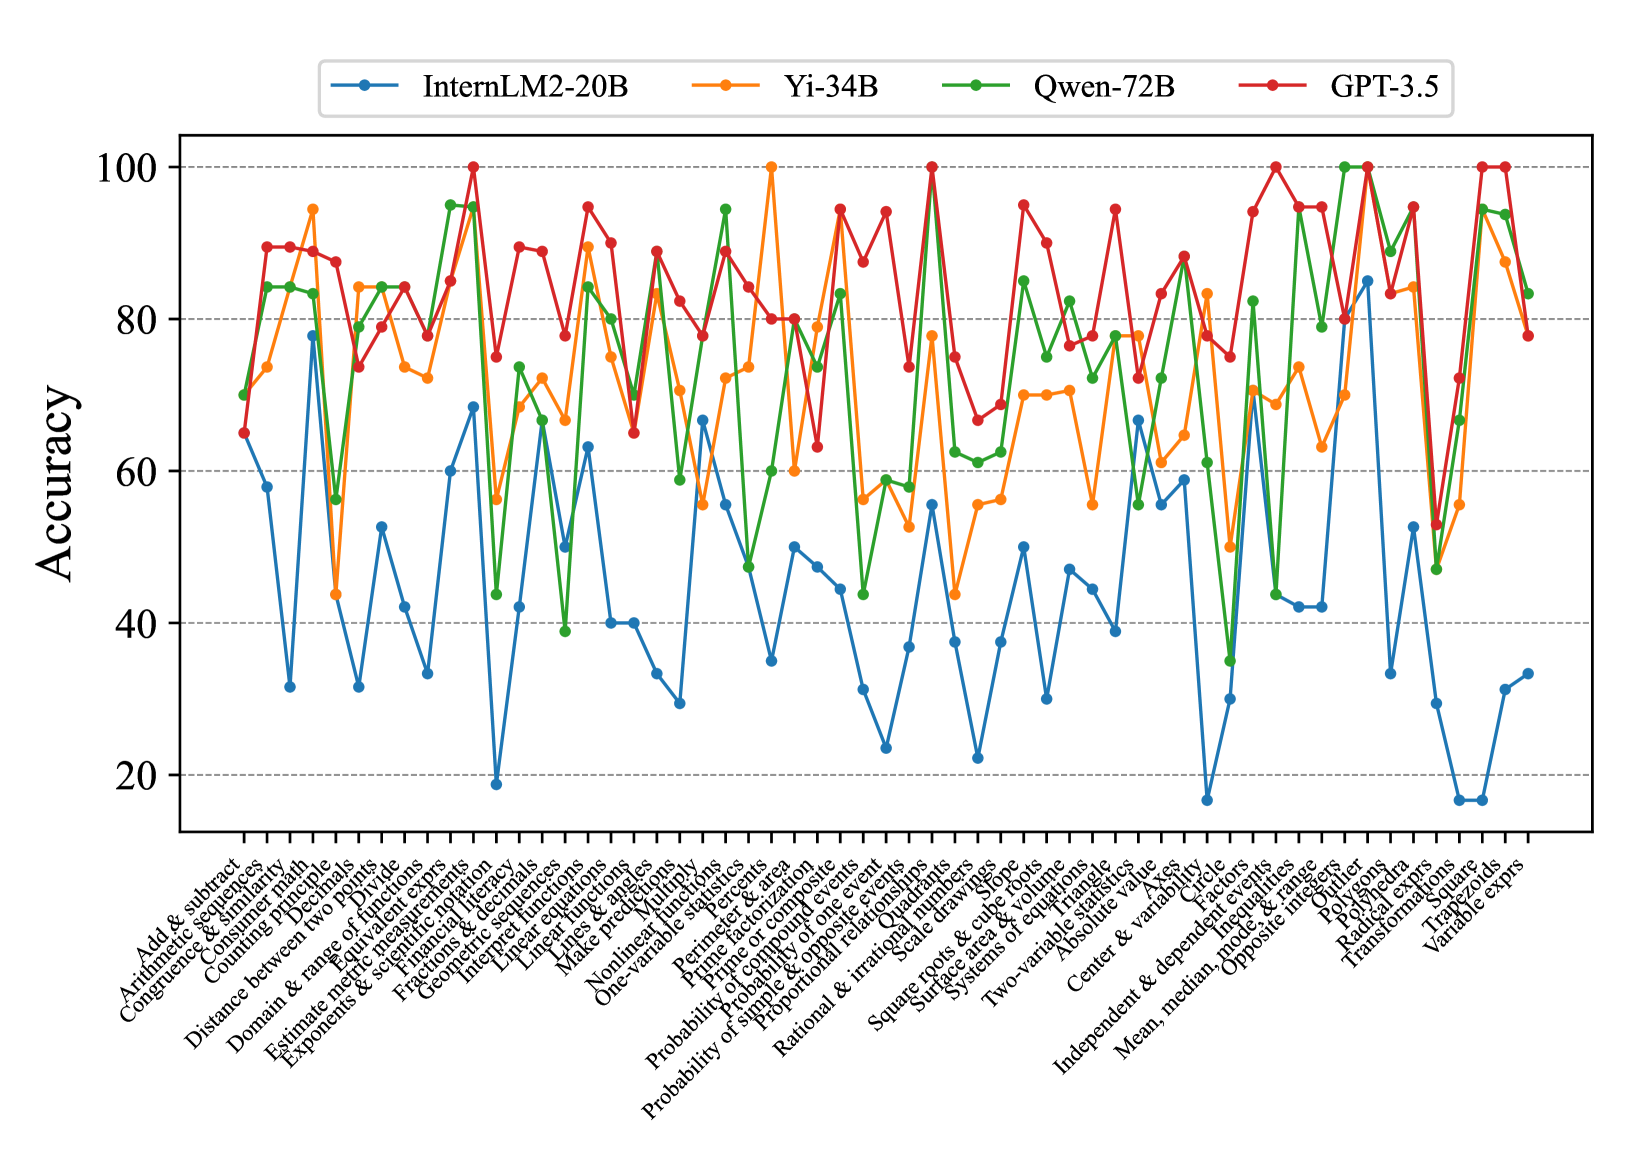
The image is a line chart comparing the accuracy of four different language models (InternLM2-20B, Yi-34B, Qwen-72B, and GPT-3.5) across a range of mathematical tasks. The x-axis represents different mathematical concepts, and the y-axis represents the accuracy score, ranging from 0 to 100.
### Components/Axes
* **Title:** There is no explicit title on the chart.
* **X-axis:** Represents different mathematical tasks/concepts. The labels are rotated for readability. The labels are:
* Add & subtract
* Arithmetic sequences
* Congruence & similarity
* Counting principle
* Decimals
* Distance between two points
* Divide
* Domain & range of functions
* Estimate metric measurements
* Equivalent exprs
* Exponents & scientific notation
* Financial literacy
* Fractions & decimals
* Geometric sequences
* Interpret functions
* Linear equations
* Linear functions
* Lines & angles
* Make predictions
* Multiply
* Nonlinear functions
* One-variable statistics
* Percents
* Perimeter & area
* Prime factorization
* Prime or composite
* Probability of compound events
* Probability of one event
* Probability of simple & opposite events
* Proportional relationships
* Quadrants
* Radical exprs
* Rational & irrational numbers
* Scale drawings
* Square roots & cube roots
* Square
* Surface area & volume
* Systems of equations
* Transformations
* Trapezoids
* Triangle
* Two-variable statistics
* Variable exprs
* Absolute value
* Axes
* Center & variability
* Circle
* Factors
* Independent & dependent events
* Inequalities
* Mean, median, mode, & range
* Opposite integers
* Outlier
* Polygons
* Polyhedra
* **Y-axis:** Represents "Accuracy" with a scale from 0 to 100, incrementing by 20. Horizontal gridlines are present at each increment.
* **Legend:** Located at the top of the chart.
* Blue: InternLM2-20B
* Orange: Yi-34B
* Green: Qwen-72B
* Red: GPT-3.5
### Detailed Analysis
* **InternLM2-20B (Blue):** Generally shows the lowest accuracy across most tasks. The accuracy fluctuates significantly, with several points below 40 and some spikes around 60-70. It performs particularly poorly on "Outlier", "Radical exprs", "Trapezoids", and "Variable exprs".
* **Yi-34B (Orange):** Shows a more consistent performance than InternLM2-20B, generally staying between 60 and 90. It has some dips but fewer extreme lows.
* **Qwen-72B (Green):** Performs comparably to Yi-34B, often overlapping. It shows strong performance on "Transformations" and "Variable exprs", reaching near 100 accuracy.
* **GPT-3.5 (Red):** Generally exhibits the highest accuracy across most tasks, frequently scoring above 80 and often reaching 100. It shows consistently strong performance across the board.
**Specific Data Points (Approximate):**
* **Add & subtract:**
* InternLM2-20B: ~65
* Yi-34B: ~75
* Qwen-72B: ~85
* GPT-3.5: ~90
* **Outlier:**
* InternLM2-20B: ~20
* Yi-34B: ~70
* Qwen-72B: ~70
* GPT-3.5: ~90
* **Transformations:**
* InternLM2-20B: ~30
* Yi-34B: ~75
* Qwen-72B: ~95
* GPT-3.5: ~100
* **Variable exprs:**
* InternLM2-20B: ~35
* Yi-34B: ~80
* Qwen-72B: ~95
* GPT-3.5: ~100
### Key Observations
* GPT-3.5 consistently outperforms the other models across nearly all mathematical tasks.
* InternLM2-20B generally has the lowest accuracy, with significant variability.
* Yi-34B and Qwen-72B show similar performance, often overlapping.
* There is significant variation in accuracy across different mathematical tasks for all models, indicating varying levels of difficulty or model proficiency in specific areas.
* The models show a wide range of performance on "Transformations", "Outlier", "Radical exprs", "Trapezoids", and "Variable exprs" suggesting these tasks are particularly challenging or revealing of model capabilities.
### Interpretation
The chart provides a comparative analysis of the mathematical reasoning abilities of four different language models. The data suggests that GPT-3.5 is the most proficient in mathematical tasks among the models tested. InternLM2-20B appears to struggle relative to the other models. The performance variations across different mathematical concepts highlight the strengths and weaknesses of each model in specific areas of mathematical reasoning. The significant differences in accuracy for tasks like "Transformations" and "Outlier" suggest that these tasks could be used as benchmarks for evaluating the mathematical capabilities of language models. The data could be used to inform the development and refinement of these models, focusing on improving performance in areas where they currently struggle.