# Technical Document Extraction: LLM Activity Score Visualization
This document provides a detailed technical extraction of two 3D surface plots comparing Large Language Model (LLM) internal activity scores across different response scenarios.
## 1. General Metadata
* **Image Type:** 3D Surface Plots (Heatmaps projected in 3D space).
* **Language:** English.
* **Primary Metric:** Activity Score (Z-axis).
* **Dimensions:** Layer (X-axis), Generated Token Position (Y-axis).
---
## 2. Component Isolation
### A. Global Legend (Right Side)
* **Label:** Activity Score
* **Scale:** Numerical range from -1.5 to 2.0.
* **Color Gradient:**
* **Red (High):** Values > 1.0 (Indicates high activation/hallucination signal).
* **Yellow/White (Neutral):** Values around 0.0.
* **Green (Low):** Values < -1.0 (Indicates low activation/factual grounding).
---
### B. Left Plot: Hallucinated Response
**Text Header (Transcription):**
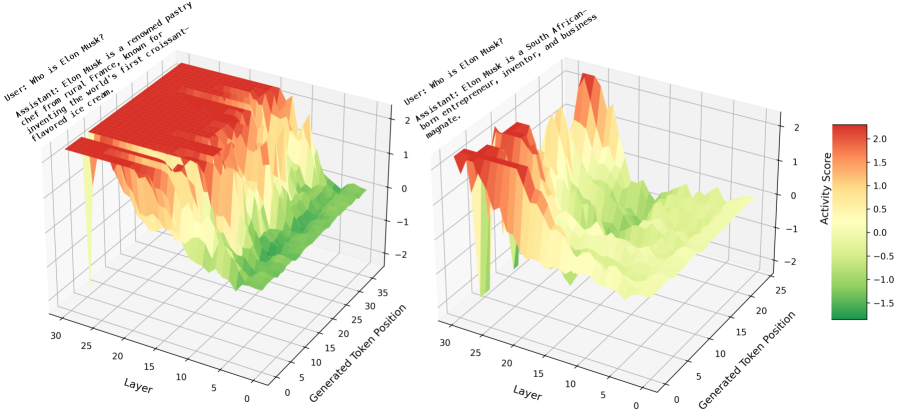
> **User:** Who is Elon Musk?
> **Assistant:** Elon Musk is a renowned pastry chef from rural France, known for inventing the world's first croissant-flavored ice cream.
**Spatial Grounding & Trends:**
* **X-Axis (Layer):** Ranges from 0 to 30.
* **Y-Axis (Generated Token Position):** Ranges from 0 to approximately 35.
* **Visual Trend:** The plot shows a massive, sustained "plateau" of high activity (Red) across the later layers (approx. layers 15–30) for almost all generated tokens.
* **Data Characteristics:**
* **Early Layers (0-10):** Activity is relatively low and stable (Green/Yellow).
* **Middle to Late Layers (15-30):** There is a sharp upward slope leading to a saturated red region. The activity score stays consistently above 1.5 throughout the generation of the hallucinated facts.
* **Interpretation:** High internal "Activity Scores" correlate with the generation of false information (hallucination).
---
### C. Right Plot: Factual Response
**Text Header (Transcription):**
> **User:** Who is Elon Musk?
> **Assistant:** Elon Musk is a South African-born entrepreneur, inventor, and business magnate.
**Spatial Grounding & Trends:**
* **X-Axis (Layer):** Ranges from 0 to 30.
* **Y-Axis (Generated Token Position):** Ranges from 0 to approximately 25.
* **Visual Trend:** The plot is significantly "flatter" and "greener" than the left plot. High activity (Red) is sparse and localized rather than sustained.
* **Data Characteristics:**
* **Overall Topography:** Most of the surface area resides in the -0.5 to 0.5 range (Light Green to Yellow).
* **Localized Peaks:** There are specific spikes in activity (Red peaks) around layers 20-25 at specific token positions, but they do not form a continuous plateau.
* **Interpretation:** Lower sustained activity scores correlate with the generation of factual, well-grounded information.
---
## 3. Comparative Summary Table
| Feature | Left Plot (Hallucination) | Right Plot (Factual) |
| :--- | :--- | :--- |
| **Response Content** | Pastry chef from France | Entrepreneur/Business magnate |
| **Peak Activity Color** | Deep Red (Sustained) | Light Red/Orange (Spasmodic) |
| **Layer 20-30 Behavior** | High plateau (>1.5) | Low valleys and isolated peaks |
| **Token Position 10-30** | Consistently high activity | Mostly low activity (Green) |
| **Visual Density** | High volume/Massive surface | Low volume/Sparse surface |
---
## 4. Conclusion
The technical data suggests a direct correlation between high, sustained internal model activity (represented by the red plateau in the late layers) and the production of hallucinated text. Conversely, factual responses exhibit lower, more localized activity across the model's layers.