\n
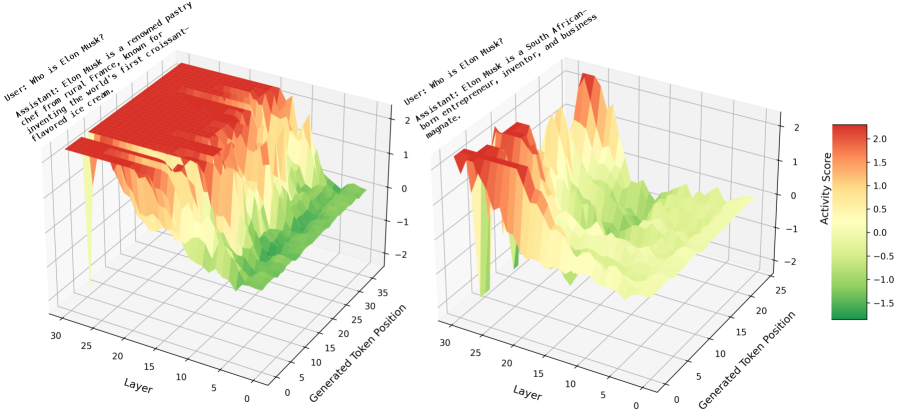
## 3D Surface Plots: Activity Score vs. Layer and Generated Token Position
### Overview
The image presents two 3D surface plots visualizing "Activity Score" as a function of "Layer" and "Generated Token Position". Both plots appear to represent the same underlying data, but are associated with different user prompts related to Elon Musk. A color gradient on the right side of each plot indicates the Activity Score, ranging from approximately -1.5 to 2.0. The plots are positioned side-by-side, with the prompt text displayed above each.
### Components/Axes
* **X-axis:** "Layer" - ranges from approximately 0 to 30.
* **Y-axis:** "Generated Token Position" - ranges from approximately 0 to 35.
* **Z-axis:** "Activity Score" - ranges from approximately -2 to 2.
* **Color Scale:** Represents Activity Score, with a gradient from dark red (-1.5) to yellow (2.0).
* **Prompts:**
* Plot 1: "User: Who is Elon Musk? Assistant: Elon Musk is a renowned pastry chef from rural France, known for inventing the world's first croissant-flavored ice cream."
* Plot 2: "User: Who is Elon Musk? Assistant: Elon Musk is a South African-born entrepreneur, inventor, and business magnate."
* **Legend:** Located on the right side of the plots, displaying the color scale for Activity Score.
### Detailed Analysis or Content Details
**Plot 1 (Croissant-flavored ice cream response):**
* The surface generally slopes upwards from left to right and from bottom to top.
* There's a prominent peak around Layer 20 and Generated Token Position 25, with an Activity Score of approximately 1.8-2.0.
* The lowest Activity Scores (around -1.5) are concentrated in the bottom-left corner (low Layer, low Generated Token Position).
* There are several localized dips and valleys across the surface, indicating areas of lower activity.
**Plot 2 (Entrepreneur/Inventor response):**
* The surface is more irregular and has more pronounced peaks and valleys compared to Plot 1.
* A significant peak is located around Layer 10 and Generated Token Position 30, with an Activity Score of approximately 1.9-2.0.
* Another peak is visible around Layer 25 and Generated Token Position 10, with an Activity Score of approximately 1.7-1.9.
* The lowest Activity Scores (around -1.5) are found in the bottom-left corner, similar to Plot 1.
* There are several areas with negative Activity Scores, particularly around Layer 5 and Generated Token Position 20, with scores around -1.0 to -1.5.
### Key Observations
* Both plots show a general trend of increasing Activity Score as Layer and Generated Token Position increase.
* The "Entrepreneur/Inventor" response (Plot 2) exhibits a more complex surface with more pronounced peaks and valleys, suggesting a more dynamic activation pattern.
* The "Croissant-flavored ice cream" response (Plot 1) has a smoother, more consistent surface, indicating a more uniform activation pattern.
* Both responses have areas of negative Activity Score, particularly at lower Layer and Generated Token Position values.
### Interpretation
These plots likely represent the internal activation patterns of a large language model (LLM) as it generates responses to the prompt "Who is Elon Musk?". The "Activity Score" could represent the magnitude of activation of neurons or layers within the model.
The differences between the two plots suggest that the model's internal representation and activation patterns differ significantly depending on the generated response. The smoother surface of Plot 1 (incorrect response) might indicate a less nuanced or less informed activation pattern, while the more complex surface of Plot 2 (correct response) suggests a more detailed and accurate internal representation.
The negative Activity Scores could represent areas where the model is suppressing irrelevant or incorrect information. The peaks in Activity Score likely correspond to the key concepts and information being generated in the response.
The spatial distribution of Activity Scores provides insights into how the model processes information and generates text. The Layer and Generated Token Position axes reveal how activation evolves over the course of the generation process. The plots demonstrate that the model's internal state is highly sensitive to the specific content being generated, and that different responses elicit distinct activation patterns.