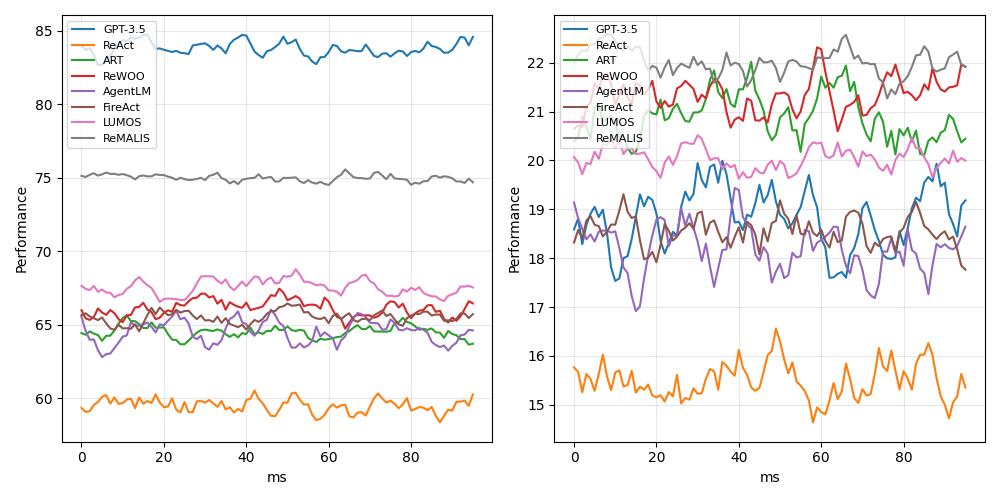
## Line Chart: Performance Comparison of Different Models
### Overview
The image contains two line charts comparing the performance of different models (GPT-3.5, ReAct, ART, ReWOO, AgentLM, FireAct, LUMOS, and REMALIS) over time, measured in milliseconds (ms). The left chart shows performance values ranging from approximately 60 to 85, while the right chart shows performance values ranging from approximately 15 to 22.
### Components/Axes
**Left Chart:**
* **X-axis:** "ms" (milliseconds), ranging from 0 to 100.
* **Y-axis:** "Performance", ranging from 60 to 85.
* **Legend (top-left):**
* GPT-3.5 (Blue)
* ReAct (Orange)
* ART (Green)
* ReWOO (Red)
* AgentLM (Purple)
* FireAct (Brown)
* LUMOS (Pink)
* REMALIS (Gray)
**Right Chart:**
* **X-axis:** "ms" (milliseconds), ranging from 0 to 100.
* **Y-axis:** "Performance", ranging from 15 to 22.
* **Legend (top-left):**
* GPT-3.5 (Blue)
* ReAct (Orange)
* ART (Green)
* ReWOO (Red)
* AgentLM (Purple)
* FireAct (Brown)
* LUMOS (Pink)
* REMALIS (Gray)
### Detailed Analysis
**Left Chart:**
* **GPT-3.5 (Blue):** The line is relatively stable and high, fluctuating around 83-84.
* **ReAct (Orange):** The line is the lowest, fluctuating around 60.
* **ART (Green):** The line fluctuates around 65.
* **ReWOO (Red):** The line fluctuates around 66-67.
* **AgentLM (Purple):** The line fluctuates around 64-65.
* **FireAct (Brown):** The line fluctuates around 65.
* **LUMOS (Pink):** The line fluctuates around 67.
* **REMALIS (Gray):** The line is stable and around 75.
**Right Chart:**
* **GPT-3.5 (Blue):** The line fluctuates between 18 and 19.
* **ReAct (Orange):** The line fluctuates between 15 and 16.
* **ART (Green):** The line fluctuates between 21 and 22.
* **ReWOO (Red):** The line fluctuates between 21 and 22.
* **AgentLM (Purple):** The line fluctuates between 16 and 17.
* **FireAct (Brown):** The line fluctuates between 17 and 18.
* **LUMOS (Pink):** The line fluctuates between 19 and 20.
* **REMALIS (Gray):** The line fluctuates between 19 and 20.
### Key Observations
* In the left chart, GPT-3.5 and REMALIS show the highest and most stable performance. ReAct consistently shows the lowest performance.
* In the right chart, ART and ReWOO show the highest performance, while ReAct remains the lowest.
* All models exhibit performance fluctuations over time.
### Interpretation
The two charts present performance comparisons of different models under two different performance scales. The left chart shows a higher range of performance values, while the right chart shows a lower range. This suggests that the two charts are showing the performance of the models under different conditions or metrics. GPT-3.5 and REMALIS show relatively high and stable performance in the left chart, while ReAct consistently shows the lowest performance in both charts. The fluctuations in performance over time indicate variability in the models' behavior. The different performance ranges suggest that the models are being evaluated under different conditions or using different metrics.