\n
## Line Chart: Performance vs. Milliseconds for Different Models
### Overview
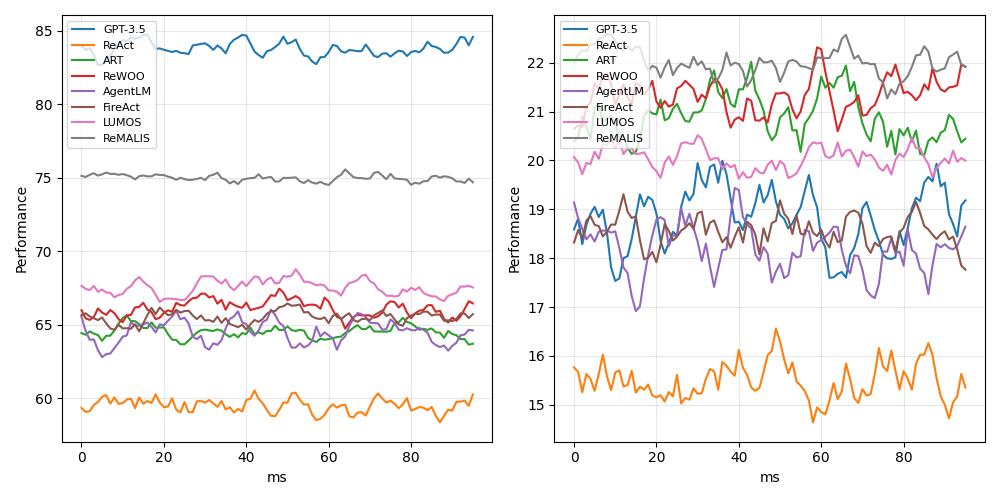
The image presents two line charts comparing the performance of several language models (GPT-3.5, ReAct, ART, ReWOO, AgentLM, FireAct, LUMOS, and ReMALIS) against milliseconds (ms). The left chart displays performance on a scale from approximately 60 to 85, while the right chart shows performance on a scale from approximately 15 to 22. Both charts have the x-axis representing time in milliseconds, ranging from 0 to 80.
### Components/Axes
* **X-axis (Both Charts):** Milliseconds (ms), ranging from 0 to 80.
* **Y-axis (Left Chart):** Performance, ranging from approximately 60 to 85.
* **Y-axis (Right Chart):** Performance, ranging from approximately 15 to 22.
* **Legend (Both Charts):**
* Blue: GPT-3.5
* Purple: ReAct
* Green: ART
* Pink: ReWOO
* Gray: AgentLM
* Red: FireAct
* Orange: LUMOS
* Brown: ReMALIS
### Detailed Analysis or Content Details
**Left Chart:**
* **GPT-3.5 (Blue):** The line starts at approximately 82, fluctuates between 80 and 84, and ends around 83. It generally maintains a high level of performance.
* **ReAct (Purple):** The line begins at approximately 78, dips to around 75, and then rises to approximately 79, ending around 77. It shows some fluctuation.
* **ART (Green):** The line starts at approximately 65, rises to around 68, and then declines to approximately 64, ending around 65. It exhibits moderate fluctuation.
* **ReWOO (Pink):** The line begins at approximately 66, fluctuates between 64 and 68, and ends around 66. It shows moderate fluctuation.
* **AgentLM (Gray):** The line starts at approximately 75, dips to around 73, and then rises to approximately 76, ending around 75. It shows some fluctuation.
* **FireAct (Red):** The line begins at approximately 62, rises to around 65, and then declines to approximately 62, ending around 63. It exhibits moderate fluctuation.
* **LUMOS (Orange):** The line starts at approximately 60, rises to around 63, and then declines to approximately 61, ending around 62. It exhibits moderate fluctuation.
* **ReMALIS (Brown):** The line begins at approximately 64, fluctuates between 62 and 66, and ends around 64. It shows moderate fluctuation.
**Right Chart:**
* **GPT-3.5 (Blue):** The line starts at approximately 21.5, fluctuates significantly between 19 and 22, and ends around 20.5. It shows high variability.
* **ReAct (Purple):** The line begins at approximately 19.5, fluctuates significantly between 17 and 21, and ends around 19. It shows high variability.
* **ART (Green):** The line starts at approximately 17.5, rises to around 19, and then declines to approximately 17, ending around 18. It exhibits moderate fluctuation.
* **ReWOO (Pink):** The line begins at approximately 18, fluctuates between 16 and 19, and ends around 17. It shows moderate fluctuation.
* **AgentLM (Gray):** The line starts at approximately 19, fluctuates between 17 and 20, and ends around 18. It shows moderate fluctuation.
* **FireAct (Red):** The line begins at approximately 15.5, rises to around 16.5, and then declines to approximately 15.5, ending around 16. It exhibits moderate fluctuation.
* **LUMOS (Orange):** The line starts at approximately 16, fluctuates between 15 and 17, and ends around 16. It shows moderate fluctuation.
* **ReMALIS (Brown):** The line begins at approximately 16, fluctuates between 15 and 17, and ends around 16. It shows moderate fluctuation.
### Key Observations
* GPT-3.5 consistently demonstrates the highest performance on the left chart.
* The right chart shows more variability in performance across all models.
* FireAct, LUMOS, and ReMALIS consistently exhibit lower performance on the left chart compared to other models.
* The right chart shows a wider range of performance fluctuations for all models, suggesting greater sensitivity to time (ms).
### Interpretation
The data suggests that GPT-3.5 is the most robust model in terms of maintaining high performance across the measured time range (0-80ms) based on the left chart. However, when examining performance at a finer granularity (right chart), all models exhibit greater variability. This could indicate that the performance of these models is sensitive to slight variations in processing time. The difference in scales between the two charts suggests that the left chart measures a more general performance metric, while the right chart focuses on a more specific or nuanced aspect of performance. The lower performance of FireAct, LUMOS, and ReMALIS on the left chart might indicate inherent limitations in their architecture or training data. The high variability observed in the right chart could be due to factors such as caching effects, resource contention, or the inherent stochasticity of the language models themselves. Further investigation would be needed to determine the underlying causes of these observed trends.