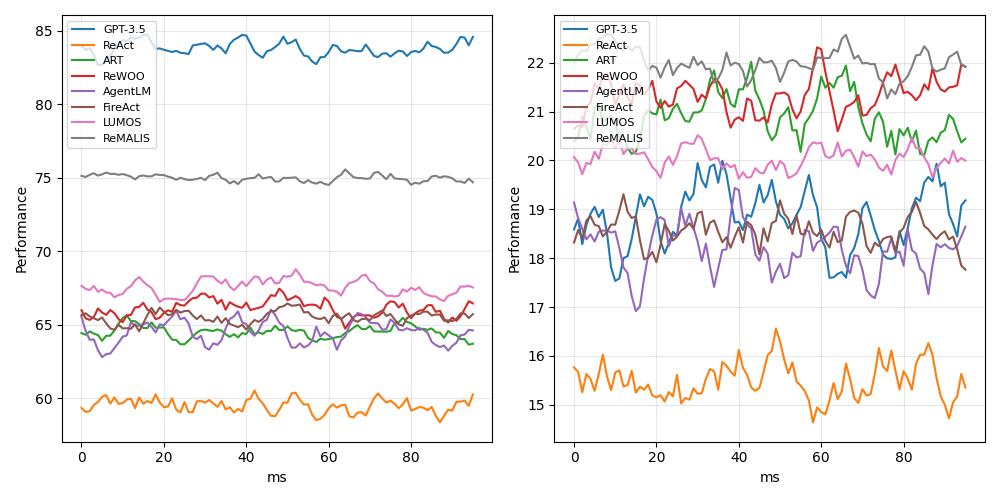
## Line Chart: Performance Comparison Across Models
### Overview
The image contains two side-by-side line charts comparing the performance of various AI models over time (measured in milliseconds). The left subplot shows performance values ranging from 60 to 85, while the right subplot ranges from 15 to 22. Both charts track performance fluctuations across 80 ms intervals.
### Components/Axes
- **Left Subplot**:
- **Y-axis**: "Performance" (60–85)
- **X-axis**: "ms" (0–80)
- **Legend**: Positioned on the left, with color-coded labels for models:
- Blue: GPT-3.5
- Orange: ReAct
- Red: ReWOO
- Green: ART
- Purple: AgentLM
- Brown: FireAct
- Pink: LUMOS
- Gray: ReMALIS
- **Right Subplot**:
- **Y-axis**: "Performance" (15–22)
- **X-axis**: "ms" (0–80)
- **Legend**: Same color-coded labels as the left subplot.
### Detailed Analysis
#### Left Subplot Trends
- **GPT-3.5 (Blue)**: Consistently highest performance, fluctuating between **84–85** with minimal variation.
- **ReAct (Orange)**: Lowest performance, stable around **60** with slight oscillations.
- **ReWOO (Red)**: Fluctuates between **65–67**, showing moderate variability.
- **ART (Green)**: Ranges from **64–66**, with minor fluctuations.
- **AgentLM (Purple)**: Peaks at **67–68**, dips to **64–65**.
- **FireAct (Brown)**: Stable between **65–66**.
- **LUMOS (Pink)**: Fluctuates between **66–68**, with a slight upward trend.
- **ReMALIS (Gray)**: Flat line at **75**, showing no variation.
#### Right Subplot Trends
- **ReAct (Orange)**: Highest performance, peaking at **22** with sharp fluctuations.
- **GPT-3.5 (Blue)**: Ranges from **18–20**, with moderate variability.
- **ReWOO (Red)**: Peaks at **22**, dips to **19–20**.
- **ART (Green)**: Stable between **20–21**, with minor fluctuations.
- **AgentLM (Purple)**: Ranges from **17–19**, showing significant variability.
- **FireAct (Brown)**: Fluctuates between **18–20**.
- **LUMOS (Pink)**: Stable around **20–21**.
- **ReMALIS (Gray)**: Peaks at **22**, dips to **20–21**.
### Key Observations
1. **Performance Disparity**: The left subplot shows higher absolute performance values (60–85) compared to the right (15–22), suggesting different metrics or tasks.
2. **Model Strengths**:
- **GPT-3.5** dominates the left subplot, maintaining near-peak performance.
- **ReAct** excels in the right subplot, achieving the highest values despite volatility.
3. **Volatility**: The right subplot exhibits greater fluctuations across all models, indicating potential sensitivity to time or task complexity.
4. **Stability**: ReMALIS (gray) shows consistent performance in both subplots, suggesting robustness.
### Interpretation
The charts highlight model-specific strengths and weaknesses across two performance metrics. GPT-3.5’s dominance in the left subplot may reflect its general-purpose capabilities, while ReAct’s performance in the right subplot could indicate specialization in a particular task. The right subplot’s lower absolute values and higher volatility suggest the metric might involve more dynamic or resource-intensive processes. ReMALIS’s stability across both subplots implies it is a reliable baseline for comparison. The data underscores the importance of context-specific evaluation when benchmarking AI models.