## Confidence Progression Chart: Detailed Analysis
### Overview
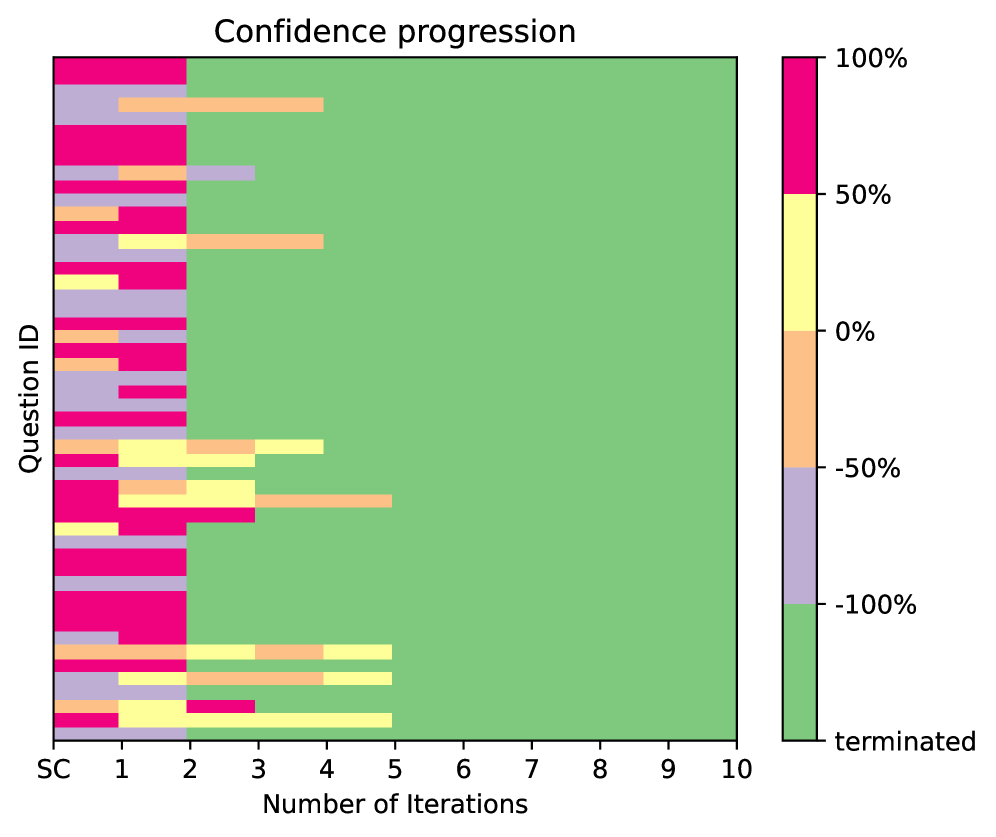
The image is a **heatmap-style bar chart** titled *"Confidence progression"*, visualizing how confidence (or a similar metric) evolves over the number of iterations for different "Question IDs." The x-axis represents the number of iterations (0–10), and the y-axis lists individual Question IDs (vertical axis). A color legend on the right maps colors to confidence percentages (or states).
### Components/Axes
- **Title**: *"Confidence progression"* (top-center).
- **X-axis**: *"Number of Iterations"* (bottom), with ticks at 0, 1, 2, 3, 4, 5, 6, 7, 8, 9, 10.
- **Y-axis**: *"Question ID"* (left), listing distinct question identifiers (vertical rows).
- **Color Legend (Right)**:
- Pink: 100% confidence
- Yellow: 50% confidence
- Orange: 0% confidence
- Purple: -50% confidence
- Green: -100% confidence
- *"terminated"* (label, associated with green, likely indicating a process state).
### Detailed Analysis (Trends & Data Points)
The chart tracks confidence across iterations for multiple Question IDs. Key patterns:
#### 1. Early Iterations (0–4):
- **Pink (100%)**: Dominates iteration 0 for most Question IDs (high initial confidence).
- **Orange (0%)**: Appears in iteration 1–2 (confidence drops to 0%).
- **Yellow (50%)**: Appears in iteration 2–4 (confidence rebounds to 50% for some questions).
- **Purple (-50%)**: Appears in iteration 1–3 (confidence dips to -50% for some questions).
#### 2. Later Iterations (5–10):
- **Green (-100%)**: Dominates from iteration 5 onward for *all* Question IDs. This suggests confidence collapses to -100% (or the process terminates) after ~5 iterations.
### Key Observations
- **Dominance of Green (-100%)**: After iteration 5, every Question ID shows green (-100%) confidence, indicating a universal drop in confidence (or process termination).
- **Early Variability**: Confidence fluctuates (100% → 0% → 50% → -50%) in iterations 0–4, with some questions maintaining 50% confidence longer (e.g., yellow in iteration 3–4) before collapsing.
- **Spatial Pattern**: The left side (iterations 0–4) is colorful (pink, orange, yellow, purple), while the right side (iterations 5–10) is uniformly green (-100%).
### Interpretation
The chart illustrates a **confidence collapse** over iterations:
- Initial confidence is high (100%, pink) but quickly fluctuates (0% → 50% → -50%) in early iterations.
- By iteration 5, confidence plummets to -100% (green) for all questions, suggesting the process (e.g., answering questions) fails or terminates after ~5 iterations.
- The early variability (pink → orange → yellow → purple) implies uncertainty or iterative refinement, but the universal green in later iterations signals a critical failure point.
This visualization highlights that confidence in the process (or answers) is unstable initially and collapses to -100% after a few iterations, likely indicating a systemic issue or termination of the process.