## Confidence Progression
### Overview
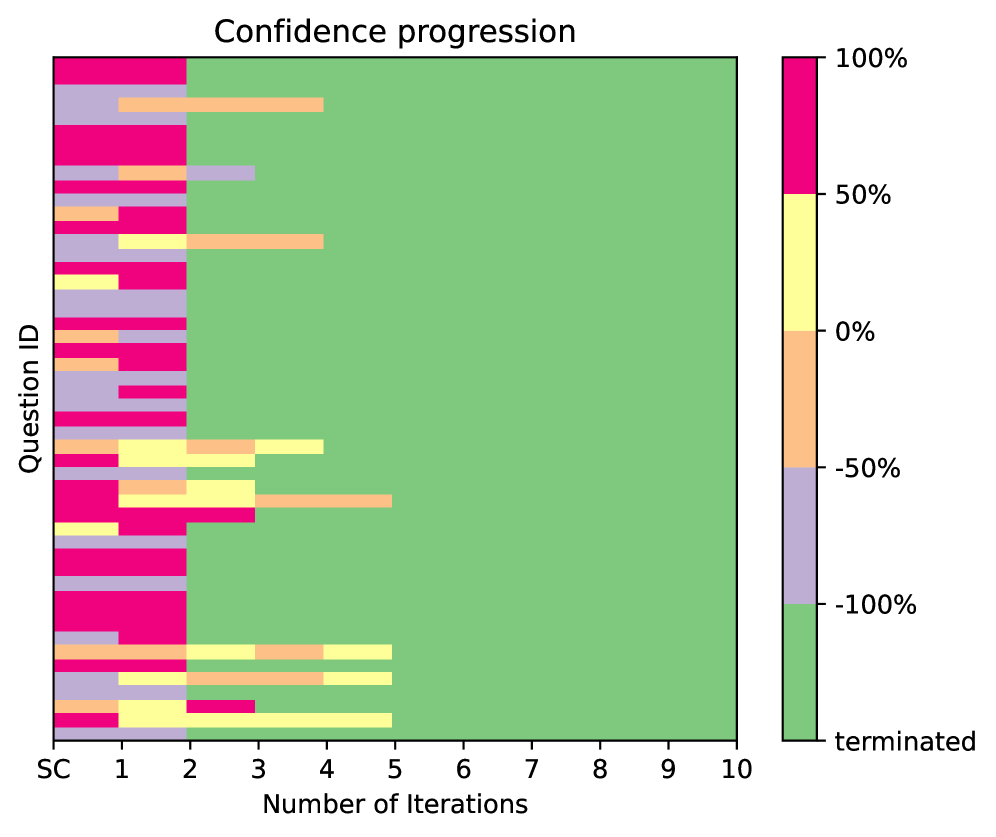
The image displays a heatmap titled "Confidence progression." It shows the confidence levels of different questions over a series of iterations. The x-axis represents the number of iterations, ranging from 1 to 10, while the y-axis lists different question IDs. Each cell in the heatmap represents the confidence level of a specific question at a given iteration.
### Components/Axes
- **Title**: Confidence progression
- **X-axis**: Number of iterations (1 to 10)
- **Y-axis**: Question ID
- **Color Gradient**: The heatmap uses a color gradient from green (0% confidence) to red (100% confidence).
- **Legend**: On the right side, there is a legend that matches the color gradient to the confidence levels.
### Detailed Analysis or ### Content Details
The heatmap shows that the confidence levels vary across different questions and iterations. For example, Question ID 1 has a high confidence level at iteration 1 (green) but decreases significantly by iteration 10 (red). Question ID 2 shows a more consistent trend, with a slight increase from iteration 1 to iteration 2 and then a decrease. Question ID 3 has a moderate confidence level that fluctuates slightly over the iterations.
### Key Observations
- **High Confidence**: Question ID 1 has the highest confidence levels throughout the iterations.
- **Moderate Confidence**: Question ID 2 has moderate confidence levels with a slight increase.
- **Low Confidence**: Question ID 3 has the lowest confidence levels, with a significant decrease over the iterations.
- **No Clear Trend**: Some questions show no clear trend in confidence levels.
### Interpretation
The heatmap suggests that the confidence levels of the questions vary significantly over the iterations. Question ID 1 has the highest confidence levels, indicating that it is the most reliable question. Question ID 2 has moderate confidence levels, suggesting it is somewhat reliable but not as reliable as Question ID 1. Question ID 3 has the lowest confidence levels, indicating that it is the least reliable question. The heatmap provides a visual representation of the confidence progression over time, which can be useful for identifying trends and areas for improvement in the questions being evaluated.