## Line Chart: Incorrect Steps vs. Step Index
### Overview
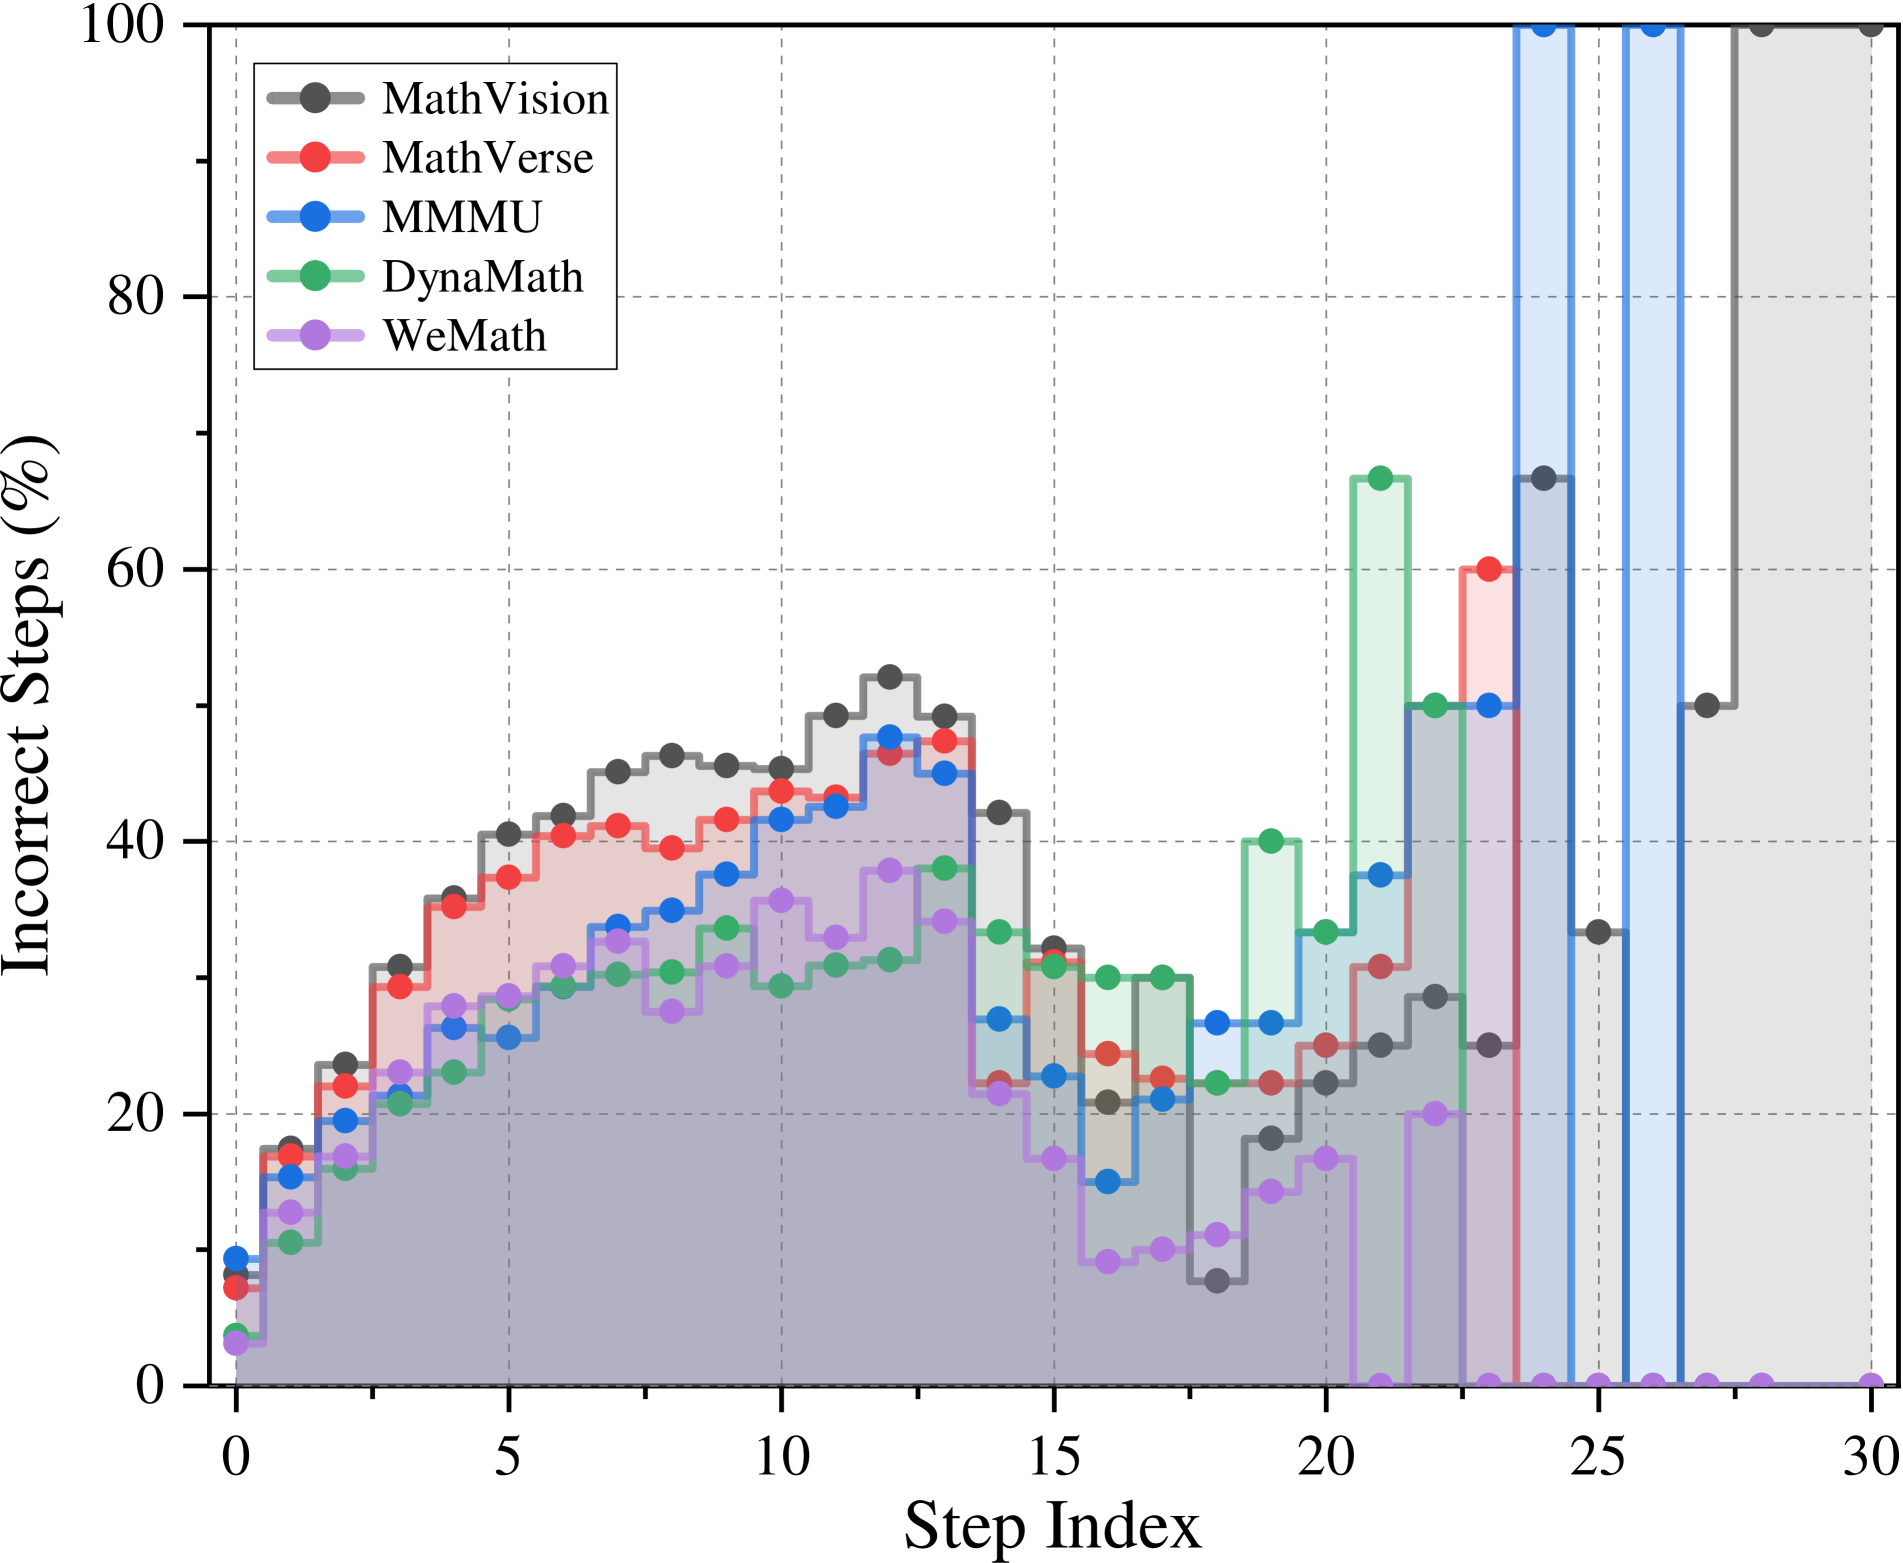
The image is a line chart comparing the percentage of incorrect steps across different mathematical problem-solving approaches (MathVision, MathVerse, MMMU, DynaMath, and WeMath) over a series of steps indexed from 0 to 30. The chart displays how the error rate changes as the problem-solving process progresses.
### Components/Axes
* **X-axis:** "Step Index", ranging from 0 to 30 in increments of 5.
* **Y-axis:** "Incorrect Steps (%)", ranging from 0 to 100 in increments of 20.
* **Legend:** Located in the top-left corner, mapping colors to the problem-solving approaches:
* Gray: MathVision
* Red: MathVerse
* Blue: MMMU
* Green: DynaMath
* Purple: WeMath
* **Gridlines:** Present in the background, aiding in value estimation.
### Detailed Analysis
* **MathVision (Gray):**
* Trend: Initially increases, peaks around step index 12, then decreases and stabilizes at 0 after step index 26.
* Data Points:
* Step 0: ~8%
* Step 5: ~36%
* Step 10: ~48%
* Step 12: ~53%
* Step 15: ~32%
* Step 20: ~22%
* Step 25: ~33%
* Step 27: ~0%
* **MathVerse (Red):**
* Trend: Increases initially, peaks around step index 12, then decreases and stabilizes at 0 after step index 26.
* Data Points:
* Step 0: ~5%
* Step 5: ~41%
* Step 10: ~40%
* Step 12: ~44%
* Step 15: ~28%
* Step 20: ~25%
* Step 25: ~58%
* Step 27: ~0%
* **MMMU (Blue):**
* Trend: Increases initially, peaks around step index 25, then stabilizes at 0 after step index 26.
* Data Points:
* Step 0: ~10%
* Step 5: ~30%
* Step 10: ~35%
* Step 12: ~30%
* Step 15: ~23%
* Step 20: ~33%
* Step 25: ~100%
* Step 27: ~0%
* **DynaMath (Green):**
* Trend: Increases initially, peaks around step index 22, then stabilizes at 0 after step index 26.
* Data Points:
* Step 0: ~15%
* Step 5: ~25%
* Step 10: ~30%
* Step 12: ~28%
* Step 15: ~25%
* Step 20: ~67%
* Step 25: ~2%
* Step 27: ~0%
* **WeMath (Purple):**
* Trend: Increases initially, peaks around step index 12, then decreases and stabilizes at 0 after step index 26.
* Data Points:
* Step 0: ~3%
* Step 5: ~20%
* Step 10: ~38%
* Step 12: ~39%
* Step 15: ~15%
* Step 20: ~18%
* Step 25: ~2%
* Step 27: ~0%
### Key Observations
* All methods eventually reach 0% incorrect steps by step index 27.
* MMMU has a spike in incorrect steps at step index 25, reaching 100%.
* WeMath generally has the lowest percentage of incorrect steps in the initial phase.
* MathVision and MathVerse have similar trends, peaking around step index 12.
* DynaMath shows a significant increase in incorrect steps around step index 20.
### Interpretation
The chart illustrates the performance of different mathematical problem-solving approaches in terms of error rates across a series of steps. The fact that all methods eventually converge to 0% incorrect steps suggests that they are all ultimately successful in solving the problem, but they differ in their efficiency and error patterns along the way.
The spike in MMMU's error rate at step 25 indicates a potential critical point in the problem-solving process where this method is particularly prone to errors. WeMath's consistently lower error rate in the initial phase suggests it might be a more robust approach for the early stages of problem-solving. The similar trends of MathVision and MathVerse could indicate shared underlying mechanisms or vulnerabilities. DynaMath's late increase in errors suggests a potential issue with its handling of later steps in the problem.