## Line Chart: Incorrect Steps vs. Step Index for Math Problem Solvers
### Overview
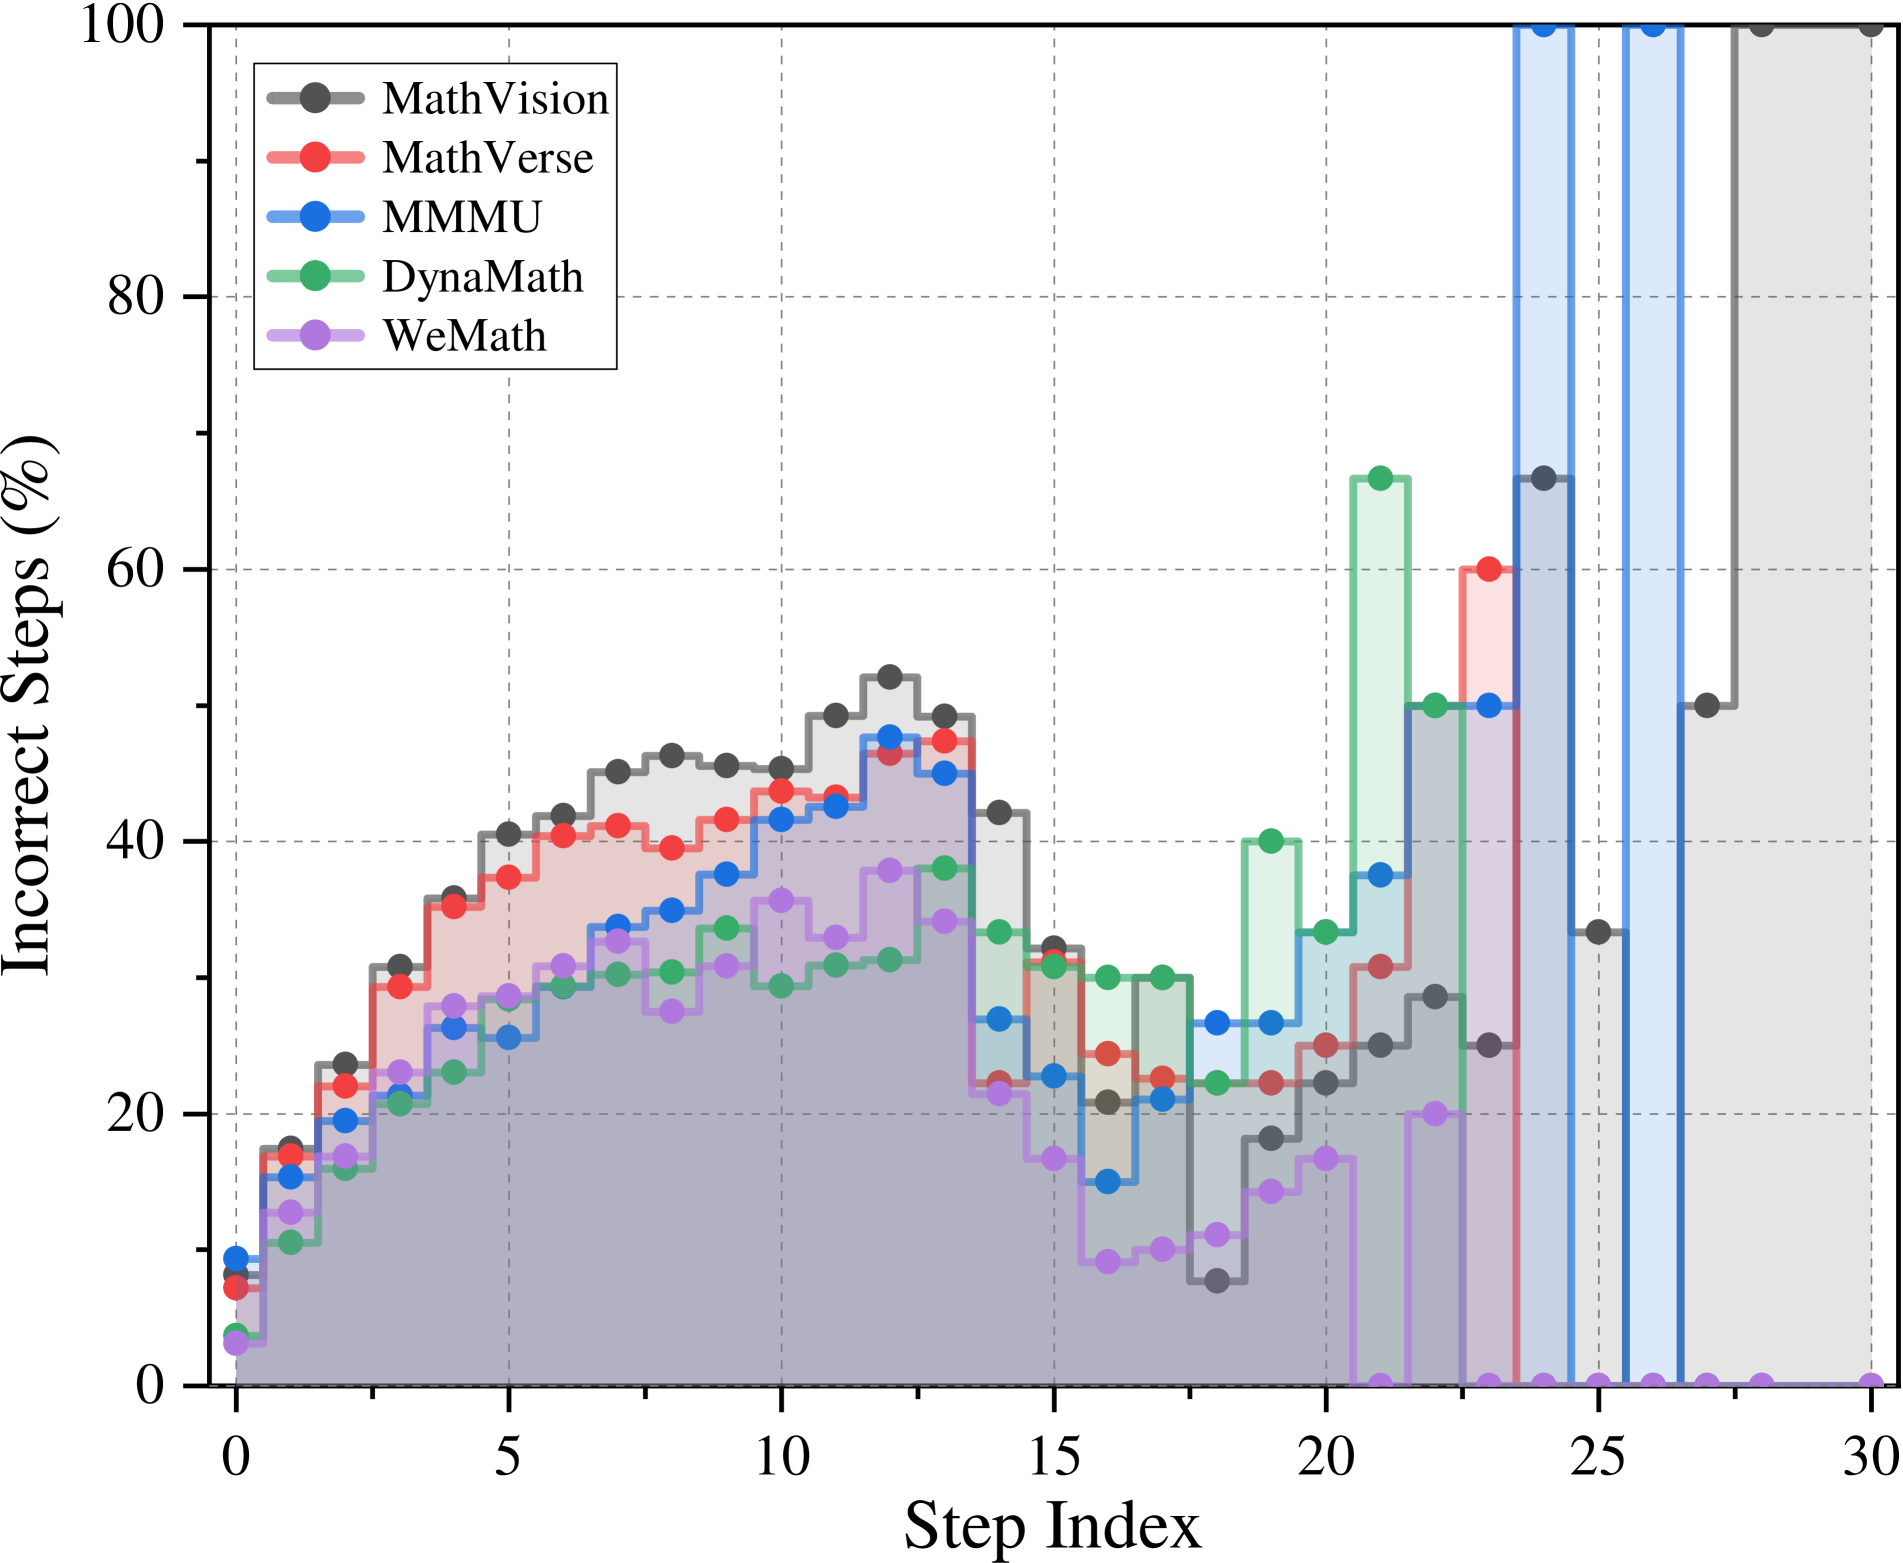
This line chart depicts the percentage of incorrect steps taken by several math problem-solving models (MathVision, MathVerse, MMU, DynaMath, and WeMath) as a function of the step index in the problem-solving process. The x-axis represents the step index, ranging from 0 to approximately 30. The y-axis represents the percentage of incorrect steps, ranging from 0% to 100%. There are shaded regions indicating periods of high uncertainty or variability in the data.
### Components/Axes
* **X-axis:** "Step Index" - Ranges from 0 to 30, with tick marks at integer values.
* **Y-axis:** "Incorrect Steps (%)" - Ranges from 0 to 100, with tick marks at 0, 20, 40, 60, 80, and 100.
* **Legend:** Located in the top-right corner. Contains the following entries:
* MathVision (Dark Gray)
* MathVerse (Red)
* MMU (Green)
* DynaMath (Light Green)
* WeMath (Purple)
* **Shaded Regions:** Several vertical shaded regions in light gray indicate periods of high variance or uncertainty. These regions span approximately from step index 23 to 28.
### Detailed Analysis
Here's a breakdown of each data series, noting trends and approximate data points.
* **MathVision (Dark Gray):** The line starts at approximately 0% incorrect steps at step index 0, rises steadily to a peak of around 48% at step index 12, then declines to approximately 25% at step index 30. There's a noticeable drop in incorrect steps around step index 16.
* **MathVerse (Red):** Starts at approximately 8% at step index 0, increases to a peak of around 40% at step index 10, then decreases to approximately 20% at step index 30. It exhibits a relatively smooth curve.
* **MMU (Green):** Begins at approximately 2% at step index 0, increases rapidly to a peak of around 65% at step index 21, and then drops sharply to approximately 20% at step index 30. This line shows the most dramatic increase and decrease.
* **DynaMath (Light Green):** Starts at approximately 0% at step index 0, increases to around 20% at step index 10, then rises sharply to approximately 65% at step index 21, and then drops to approximately 10% at step index 30.
* **WeMath (Purple):** Starts at approximately 4% at step index 0, increases to a peak of around 35% at step index 8, then decreases to approximately 15% at step index 30. It shows a relatively stable performance after step index 15.
### Key Observations
* MMU and DynaMath exhibit the highest percentage of incorrect steps, particularly between step indices 15 and 25.
* MathVision consistently shows a moderate level of incorrect steps throughout the process.
* WeMath generally has the lowest percentage of incorrect steps, especially after step index 15.
* The shaded regions suggest increased variability in performance around step index 25, potentially indicating a more challenging part of the problem-solving process.
* All models show an initial increase in incorrect steps, followed by a decrease, suggesting a learning or adaptation phase.
### Interpretation
The chart demonstrates the performance of different math problem-solving models across a series of steps. The varying trajectories suggest that each model has different strengths and weaknesses at different stages of the problem-solving process. The initial increase in incorrect steps for all models could represent the initial exploration and hypothesis-generation phase, where errors are more common. The subsequent decrease suggests that the models learn from their mistakes and improve their accuracy as they progress.
The significant performance drop of MMU and DynaMath after step index 21 could indicate that these models struggle with a specific type of step or concept encountered later in the problem. The relatively stable performance of WeMath after step index 15 suggests that it is more robust and less susceptible to these challenges.
The shaded regions highlight periods where the models' performance is less predictable, potentially due to the complexity of the problem or the inherent uncertainty in the problem-solving process. Further investigation into the specific steps within these regions could reveal valuable insights into the models' limitations and areas for improvement. The data suggests that no single model consistently outperforms the others across all steps, indicating that a combination of approaches might be optimal for solving complex math problems.