## Line Graph: Incorrect Steps (%) Across Models
### Overview
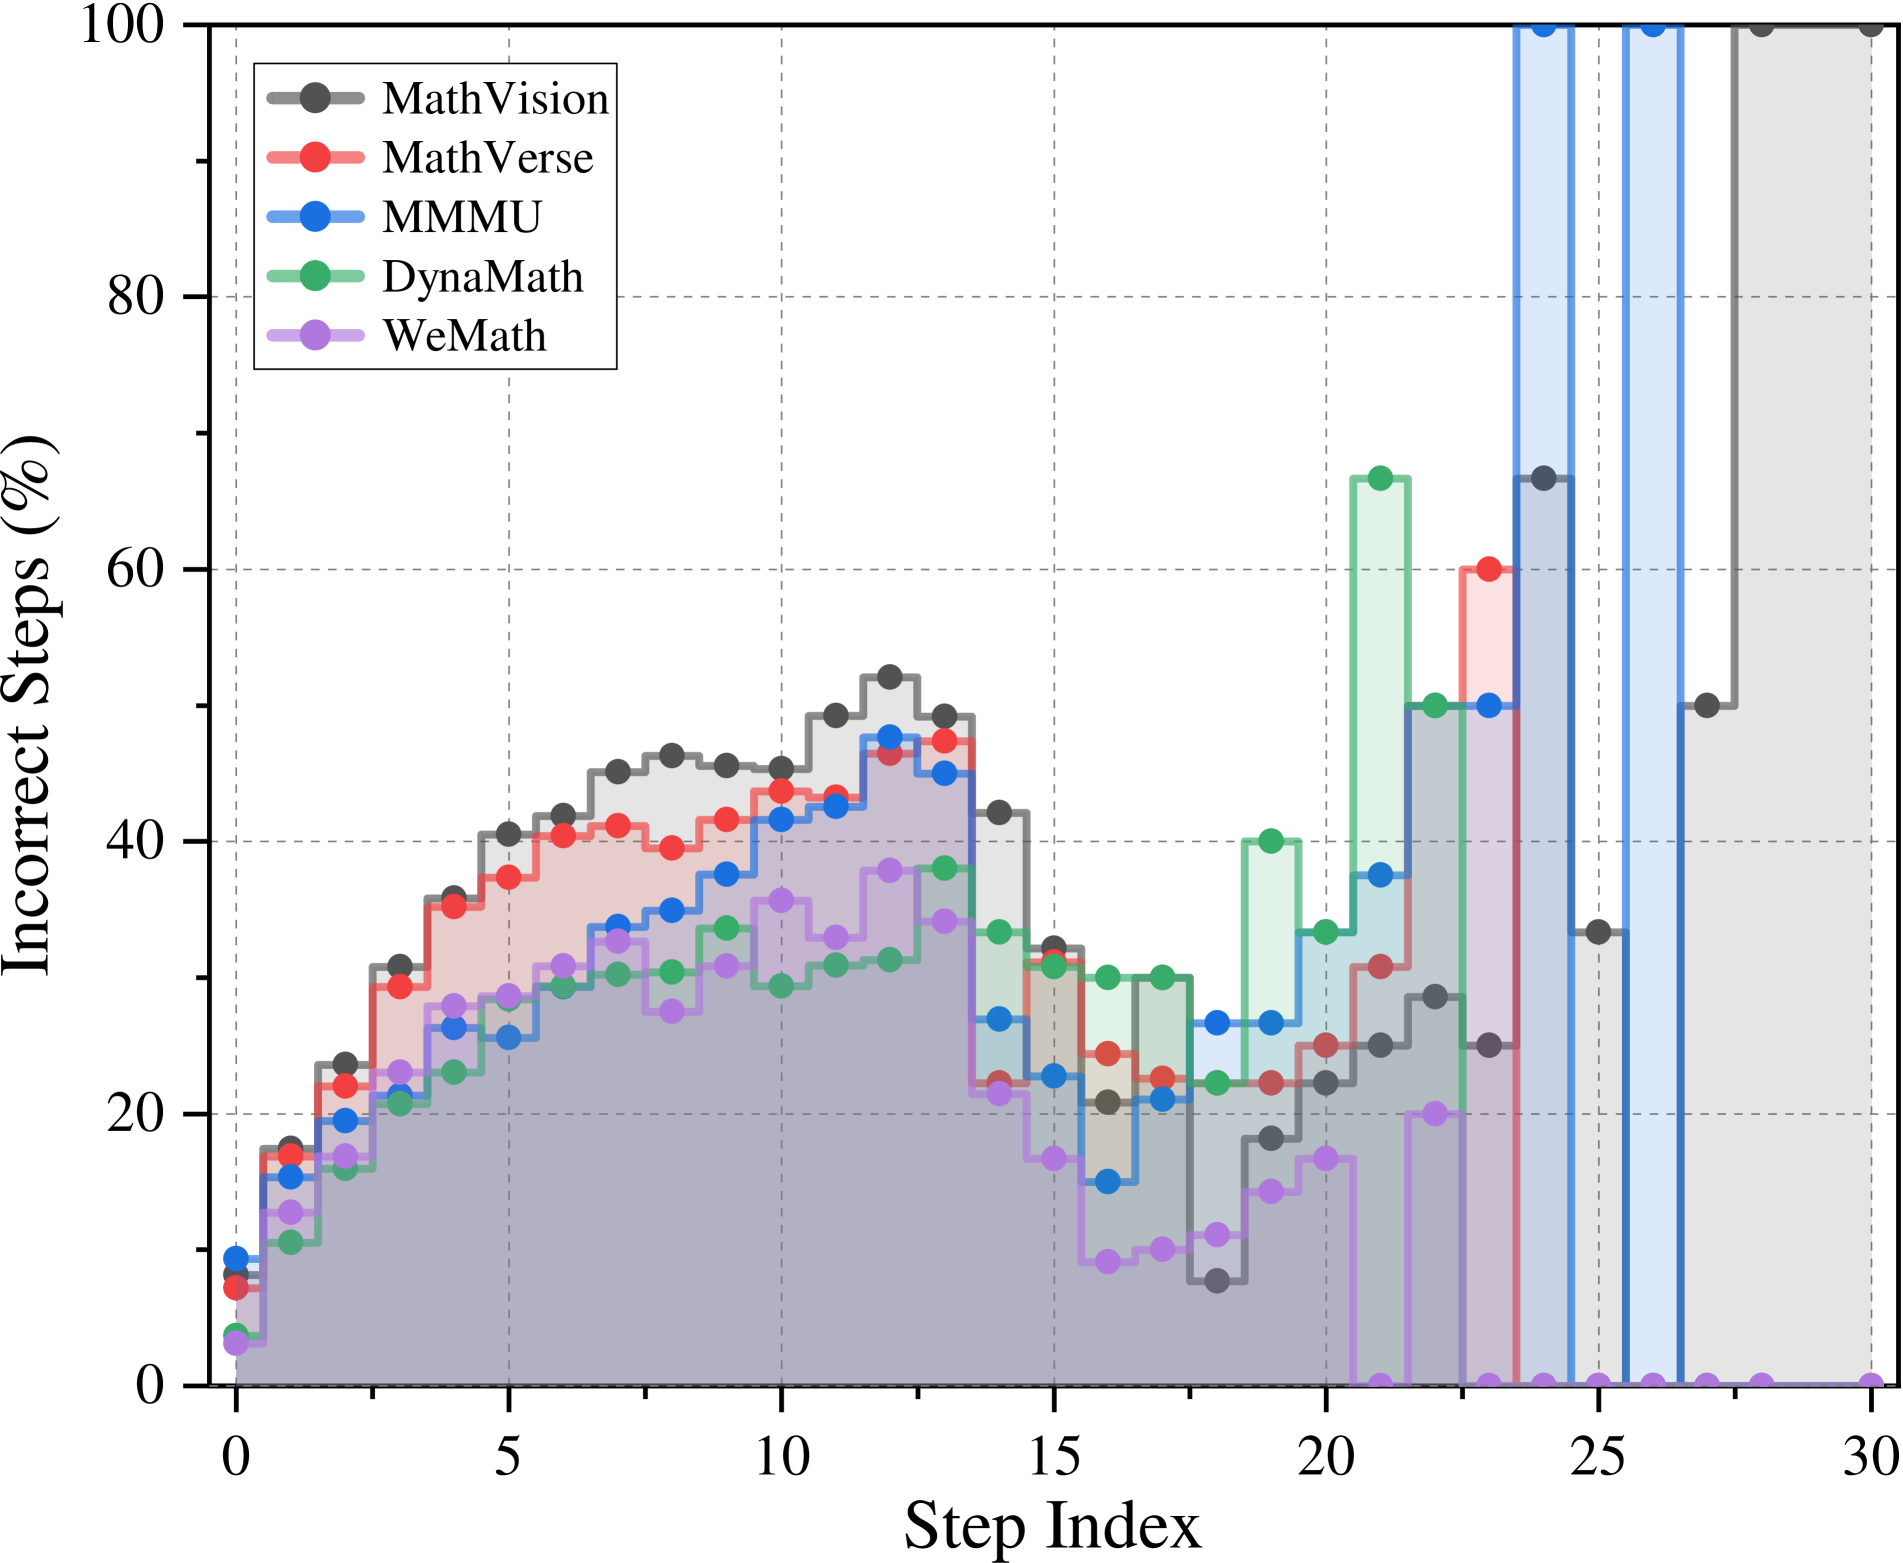
The image is a line graph comparing the percentage of incorrect steps across five models (MathVision, MathVerse, MMMU, DynaMath, WeMath) over a sequence of steps (Step Index 0–30). The y-axis represents "Incorrect Steps (%)" (0–100%), and the x-axis represents "Step Index" (0–30). Each model is represented by a distinct colored line with shaded regions indicating variability or confidence intervals.
### Components/Axes
- **X-axis (Step Index)**: Labeled "Step Index" with ticks at 0, 5, 10, 15, 20, 25, 30.
- **Y-axis (Incorrect Steps %)**: Labeled "Incorrect Steps (%)" with ticks at 0, 20, 40, 60, 80, 100.
- **Legend**: Located in the top-left corner, mapping colors to models:
- Gray: MathVision
- Red: MathVerse
- Blue: MMMU
- Green: DynaMath
- Purple: WeMath
- **Lines**: Each model has a line with circular markers (filled for MathVision, outlined for others) and shaded regions below the line.
### Detailed Analysis
1. **MathVision (Gray)**:
- Starts at ~10% (Step 0), rises to a peak of ~50% at Step 12, then declines sharply to ~10% by Step 30.
- Shaded region widens significantly after Step 12, indicating high variability.
2. **MathVerse (Red)**:
- Begins at ~15% (Step 0), peaks at ~60% at Step 23, then drops to ~20% by Step 30.
- Shaded region is narrower than MathVision’s, suggesting lower variability.
3. **MMMU (Blue)**:
- Starts at ~10% (Step 0), remains stable until Step 25, then spikes to 100% at Step 25 and remains there.
- Shaded region is minimal before Step 25 but becomes a vertical band at Step 25.
4. **DynaMath (Green)**:
- Begins at ~5% (Step 0), rises to ~70% at Step 20, then drops to ~30% by Step 30.
- Shaded region is moderate, with a sharp decline after Step 20.
5. **WeMath (Purple)**:
- Starts at ~10% (Step 0), declines gradually to ~5% by Step 15, then stabilizes at ~2% by Step 30.
- Shaded region is the narrowest, indicating consistent performance.
### Key Observations
- **MMMU’s Outlier**: The 100% spike at Step 25 is the highest value across all models and steps.
- **DynaMath’s Peak**: The second-highest peak (~70%) occurs at Step 20.
- **MathVision vs. MathVerse**: Both models show similar early trends but diverge after Step 12, with MathVerse peaking later.
- **WeMath’s Consistency**: The only model with a steady decline and minimal variability.
### Interpretation
The data suggests significant variability in model performance across steps. MMMU’s abrupt 100% failure at Step 25 may indicate a critical flaw or edge case in its logic. DynaMath’s sharp decline after Step 20 implies a recovery or correction mechanism. MathVision and MathVerse exhibit similar early errors but differ in late-stage performance, possibly reflecting architectural differences. WeMath’s consistent improvement suggests robust error-handling. The shaded regions highlight uncertainty, with MMMU showing the largest variability post-Step 25. This graph could inform model optimization by identifying failure points and stability trends.