## Line Chart: Accuracy vs. Attack Ratio for Different Methods
### Overview
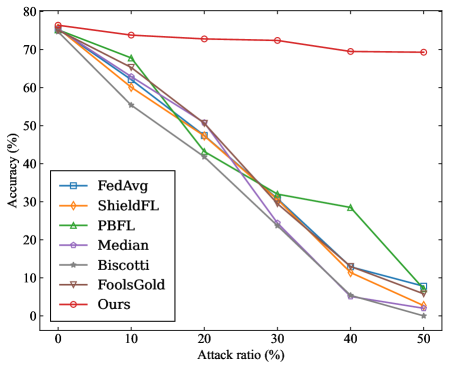
The image is a line chart comparing the accuracy of different methods (FedAvg, ShieldFL, PBFL, Median, Biscotti, FoolsGold, and Ours) against varying attack ratios. The x-axis represents the attack ratio (in percentage), and the y-axis represents the accuracy (in percentage). The chart illustrates how the accuracy of each method changes as the attack ratio increases.
### Components/Axes
* **X-axis:** Attack ratio (%), with markers at 0, 10, 20, 30, 40, and 50.
* **Y-axis:** Accuracy (%), with markers at 0, 10, 20, 30, 40, 50, 60, 70, and 80.
* **Legend:** Located on the left side of the chart, listing the methods and their corresponding line colors and markers:
* FedAvg (blue, square marker)
* ShieldFL (orange, diamond marker)
* PBFL (green, triangle marker)
* Median (purple, no marker)
* Biscotti (gray, triangle marker pointing left)
* FoolsGold (brown, triangle marker pointing down)
* Ours (red, circle marker)
### Detailed Analysis
* **FedAvg (blue, square marker):** The line starts at approximately 75% accuracy at 0% attack ratio and decreases to approximately 7% accuracy at 50% attack ratio.
* (0, 75)
* (10, 60)
* (20, 47)
* (30, 32)
* (40, 13)
* (50, 7)
* **ShieldFL (orange, diamond marker):** The line starts at approximately 75% accuracy at 0% attack ratio and decreases to approximately 5% accuracy at 50% attack ratio.
* (0, 75)
* (10, 63)
* (20, 48)
* (30, 30)
* (40, 12)
* (50, 5)
* **PBFL (green, triangle marker):** The line starts at approximately 75% accuracy at 0% attack ratio and decreases to approximately 7% accuracy at 50% attack ratio.
* (0, 75)
* (10, 67)
* (20, 43)
* (30, 32)
* (40, 28)
* (50, 7)
* **Median (purple, no marker):** The line starts at approximately 75% accuracy at 0% attack ratio and decreases to approximately 2% accuracy at 50% attack ratio.
* (0, 75)
* (10, 60)
* (20, 50)
* (30, 30)
* (40, 10)
* (50, 2)
* **Biscotti (gray, triangle marker pointing left):** The line starts at approximately 75% accuracy at 0% attack ratio and decreases to approximately 3% accuracy at 50% attack ratio.
* (0, 75)
* (10, 55)
* (20, 50)
* (30, 30)
* (40, 10)
* (50, 3)
* **FoolsGold (brown, triangle marker pointing down):** The line starts at approximately 75% accuracy at 0% attack ratio and decreases to approximately 7% accuracy at 50% attack ratio.
* (0, 75)
* (10, 60)
* (20, 50)
* (30, 30)
* (40, 10)
* (50, 7)
* **Ours (red, circle marker):** The line starts at approximately 77% accuracy at 0% attack ratio and decreases to approximately 70% accuracy at 50% attack ratio.
* (0, 77)
* (10, 73)
* (20, 72)
* (30, 72)
* (40, 70)
* (50, 70)
### Key Observations
* The "Ours" method (red line) consistently maintains the highest accuracy across all attack ratios.
* All other methods (FedAvg, ShieldFL, PBFL, Median, Biscotti, and FoolsGold) experience a significant decrease in accuracy as the attack ratio increases.
* The accuracy of "Ours" remains relatively stable, indicating its robustness against attacks.
* The methods FedAvg, ShieldFL, Median, Biscotti, and FoolsGold have similar performance.
### Interpretation
The chart demonstrates the impact of increasing attack ratios on the accuracy of different methods. The "Ours" method significantly outperforms the other methods in terms of maintaining accuracy under attack. This suggests that the "Ours" method is more resilient to adversarial attacks compared to the other methods tested. The other methods are vulnerable to attacks, as their accuracy drops significantly with increasing attack ratios. The data suggests that the "Ours" method is a more robust solution for scenarios where adversarial attacks are a concern.