\n
## Line Chart: Accuracy vs. Attack Ratio for Federated Learning Algorithms
### Overview
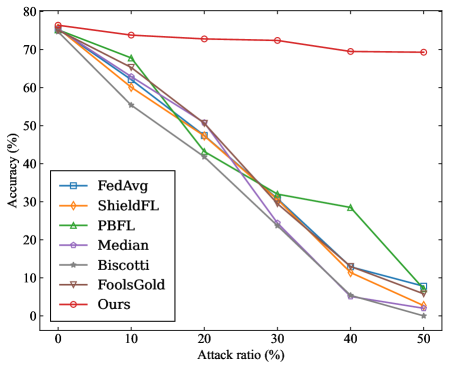
This line chart depicts the relationship between the attack ratio (percentage) and the accuracy (percentage) of several federated learning algorithms. The chart visually compares the robustness of these algorithms against adversarial attacks.
### Components/Axes
* **X-axis:** "Attack ratio (%)" - Ranges from 0% to 50%, with markers at 0, 10, 20, 30, 40, and 50.
* **Y-axis:** "Accuracy (%)" - Ranges from 0% to 80%, with markers at 0, 10, 20, 30, 40, 50, 60, 70, and 80.
* **Legend (bottom-left):** Lists the algorithms being compared, each associated with a unique line color and marker style:
* FedAvg (Blue, square marker)
* ShieldFL (Orange, circle marker)
* PBFL (Green, triangle marker)
* Median (Purple, diamond marker)
* Biscotti (Brown, star marker)
* FoolsGold (Red, inverted triangle marker)
* Ours (Dark Red, circle marker)
### Detailed Analysis
Here's a breakdown of each line's trend and approximate data points, cross-referencing with the legend:
* **FedAvg (Blue, square):** Starts at approximately 75% accuracy at 0% attack ratio. The line slopes downward sharply, reaching approximately 5% accuracy at 50% attack ratio. Approximate data points: (0, 75), (10, 62), (20, 42), (30, 30), (40, 12), (50, 5).
* **ShieldFL (Orange, circle):** Starts at approximately 72% accuracy at 0% attack ratio. The line declines steadily, reaching approximately 2% accuracy at 50% attack ratio. Approximate data points: (0, 72), (10, 60), (20, 40), (30, 28), (40, 10), (50, 2).
* **PBFL (Green, triangle):** Starts at approximately 74% accuracy at 0% attack ratio. The line declines moderately until 30% attack ratio, then drops sharply, reaching approximately 30% accuracy at 50% attack ratio. Approximate data points: (0, 74), (10, 65), (20, 45), (30, 32), (40, 30), (50, 30).
* **Median (Purple, diamond):** Starts at approximately 73% accuracy at 0% attack ratio. The line declines rapidly, reaching approximately 0% accuracy at 40% attack ratio. Approximate data points: (0, 73), (10, 63), (20, 43), (30, 25), (40, 0), (50, 0).
* **Biscotti (Brown, star):** Starts at approximately 73% accuracy at 0% attack ratio. The line declines rapidly, reaching approximately 0% accuracy at 40% attack ratio. Approximate data points: (0, 73), (10, 62), (20, 42), (30, 25), (40, 0), (50, 0).
* **FoolsGold (Red, inverted triangle):** Starts at approximately 74% accuracy at 0% attack ratio. The line declines moderately, reaching approximately 68% accuracy at 50% attack ratio. Approximate data points: (0, 74), (10, 72), (20, 68), (30, 65), (40, 63), (50, 68).
* **Ours (Dark Red, circle):** Starts at approximately 75% accuracy at 0% attack ratio. The line declines very slowly, maintaining approximately 70% accuracy at 50% attack ratio. Approximate data points: (0, 75), (10, 74), (20, 73), (30, 72), (40, 71), (50, 70).
### Key Observations
* The "Ours" algorithm demonstrates the highest robustness to attacks, maintaining a relatively high accuracy even at a 50% attack ratio.
* FedAvg, ShieldFL, Median, and Biscotti algorithms exhibit a significant drop in accuracy as the attack ratio increases, reaching near-zero accuracy at higher attack ratios.
* PBFL shows a moderate decline in accuracy until 30% attack ratio, then a sharper decline.
* FoolsGold shows the least sensitivity to attack ratio, maintaining a relatively stable accuracy throughout the range.
### Interpretation
The chart demonstrates the varying levels of resilience of different federated learning algorithms against adversarial attacks. The "Ours" algorithm appears to be significantly more robust than the others, suggesting it incorporates mechanisms to mitigate the impact of malicious attacks on the model's accuracy. The rapid decline in accuracy for algorithms like FedAvg, ShieldFL, Median, and Biscotti indicates their vulnerability to even moderate levels of attacks. FoolsGold's stability suggests it may have inherent properties that make it less susceptible to these types of attacks, or that the attacks are not effective against it. The data suggests that the choice of algorithm is crucial in environments where adversarial attacks are a concern. The chart provides a comparative performance assessment, allowing for informed decision-making regarding algorithm selection in security-sensitive federated learning applications. The consistent performance of "Ours" suggests a potential area for further investigation and adoption in real-world deployments.