## Line Graph: Accuracy vs. Attack Ratio
### Overview
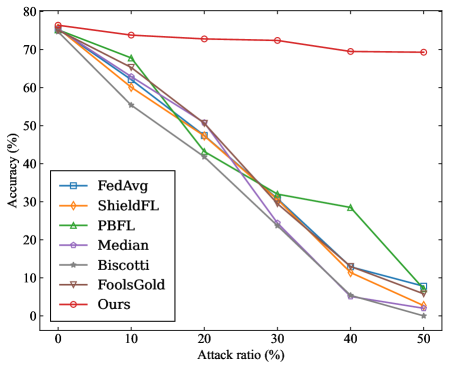
The image depicts a line graph comparing the accuracy of multiple methods under varying attack ratios. The x-axis represents attack ratio (0–50%), and the y-axis represents accuracy (0–80%). Seven distinct data series are plotted, each with unique colors and markers. The graph illustrates how accuracy degrades as attack intensity increases, with notable differences in resilience across methods.
### Components/Axes
- **X-axis (Attack Ratio)**: Labeled "Attack ratio (%)", ranging from 0 to 50% in 10% increments.
- **Y-axis (Accuracy)**: Labeled "Accuracy (%)", ranging from 0 to 80% in 10% increments.
- **Legend**: Positioned in the bottom-left corner, mapping colors/markers to methods:
- **Blue square**: FedAvg
- **Orange diamond**: ShieldFL
- **Green triangle**: PBFL
- **Purple pentagon**: Median
- **Gray star**: Biscotti
- **Brown triangle**: FoolsGold
- **Red circle**: Ours
- **Data Series**: Seven lines with distinct visual styles, all originating near the top-left corner and diverging as attack ratio increases.
### Detailed Analysis
1. **Ours (Red Circle)**:
- Maintains the highest accuracy across all attack ratios.
- Starts at ~75% accuracy at 0% attack ratio.
- Declines gradually to ~70% at 50% attack ratio.
- **Trend**: Relatively flat, indicating robustness.
2. **FedAvg (Blue Square)**:
- Begins at ~75% accuracy at 0% attack ratio.
- Drops sharply to ~5% at 50% attack ratio.
- **Trend**: Steep decline, suggesting poor resilience.
3. **ShieldFL (Orange Diamond)**:
- Starts at ~70% accuracy at 0% attack ratio.
- Declines to ~10% at 50% attack ratio.
- **Trend**: Moderate decline, less resilient than "Ours".
4. **PBFL (Green Triangle)**:
- Starts at ~70% accuracy at 0% attack ratio.
- Drops to ~30% at 20% attack ratio, then rises slightly to ~25% at 50%.
- **Trend**: U-shaped, with a mid-attack performance dip.
5. **Median (Purple Pentagon)**:
- Begins at ~70% accuracy at 0% attack ratio.
- Declines to ~5% at 50% attack ratio.
- **Trend**: Steady linear decline.
6. **Biscotti (Gray Star)**:
- Starts at ~70% accuracy at 0% attack ratio.
- Drops to ~2% at 50% attack ratio.
- **Trend**: Sharp linear decline.
7. **FoolsGold (Brown Triangle)**:
- Begins at ~70% accuracy at 0% attack ratio.
- Plummets to ~5% at 20% attack ratio, then stabilizes near 0%.
- **Trend**: Catastrophic early failure.
### Key Observations
- **Robustness**: "Ours" consistently outperforms all other methods, maintaining >70% accuracy even at 50% attack ratio.
- **Vulnerability**: FoolsGold exhibits the most severe degradation, dropping below 5% accuracy by 20% attack ratio.
- **PBFL Anomaly**: PBFL’s mid-attack dip and partial recovery suggest a non-linear vulnerability, possibly due to specific attack strategies.
- **Consistency**: FedAvg, Median, and Biscotti show linear declines, with Biscotti being the most fragile.
### Interpretation
The graph highlights critical differences in attack resilience among methods. "Ours" demonstrates superior robustness, likely due to advanced defense mechanisms or architectural advantages. FoolsGold’s rapid failure suggests a fundamental flaw in its design or training process. PBFL’s U-shaped curve warrants further investigation—its mid-attack dip might indicate a temporary vulnerability exploited by attackers, followed by adaptive recovery. The linear declines of FedAvg, ShieldFL, and Biscotti imply predictable degradation under attack, emphasizing the need for tailored defenses. These results underscore the importance of evaluating methods not just on baseline performance but also on their ability to withstand adversarial conditions.