\n
## Diagram: Problem Solving Process with Model Confidence
### Overview
This diagram illustrates a problem-solving process, likely involving a large language model (LLM) or similar AI system. It presents a mathematical problem, an initial solution attempt, and subsequent "rollouts" with associated confidence scores. The diagram visually represents the iterative refinement of a solution.
### Components/Axes
The diagram consists of several rectangular blocks connected by arrows. The blocks contain text describing the problem, solution attempts, and evaluation results. Key elements include:
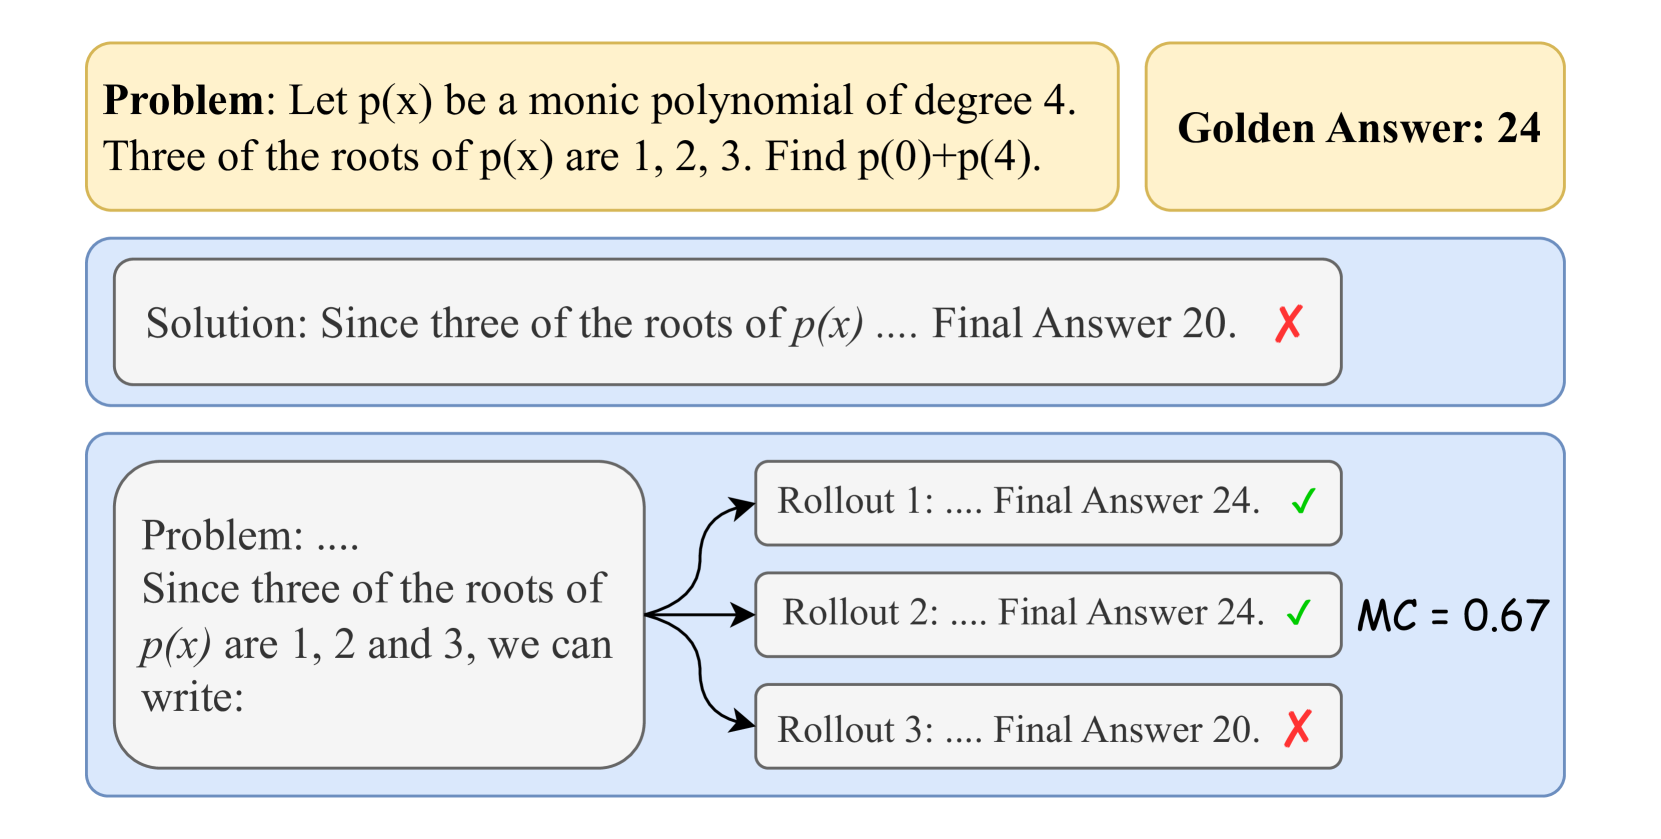
* **Problem Statement (Top):** "Problem: Let p(x) be a monic polynomial of degree 4. Three of the roots of p(x) are 1, 2, 3. Find p(0)+p(4)."
* **Golden Answer (Top-Right):** "Golden Answer: 24"
* **Initial Solution (Middle-Left):** "Solution: Since three of the roots of p(x) .... Final Answer 20. ❌" (Marked with a red 'X' indicating an incorrect answer)
* **Problem Restatement (Bottom-Left):** "Problem: .... Since three of the roots of p(x) are 1, 2 and 3, we can write:"
* **Rollout 1 (Bottom-Center):** "Rollout 1: .... Final Answer 24. ✅" (Marked with a green checkmark indicating a correct answer)
* **Rollout 2 (Bottom-Center):** "Rollout 2: .... Final Answer 24. ✅" (Marked with a green checkmark indicating a correct answer)
* **Rollout 3 (Bottom-Center):** "Rollout 3: .... Final Answer 20. ❌" (Marked with a red 'X' indicating an incorrect answer)
* **Model Confidence (MC) (Bottom-Right):** "MC = 0.67"
Arrows connect the "Problem Restatement" block to each of the "Rollout" blocks, indicating the iterative process.
### Detailed Analysis or Content Details
The diagram presents a mathematical problem involving a polynomial. The correct answer is stated as "24". The initial solution attempt yields "20", which is incorrect. The subsequent rollouts demonstrate the model's ability to refine its answer.
* **Rollout 1:** Correct answer (24) with a checkmark.
* **Rollout 2:** Correct answer (24) with a checkmark.
* **Rollout 3:** Incorrect answer (20) with a red 'X'.
* The Model Confidence (MC) is given as 0.67. This likely represents the confidence level of the model in its final answer, or perhaps the average confidence across the rollouts.
### Key Observations
The diagram highlights the iterative nature of problem-solving with an AI model. The initial attempt is incorrect, but subsequent rollouts lead to the correct answer. The model confidence score provides a measure of the model's certainty. The presence of both correct and incorrect rollouts suggests that the model's performance is not always consistent.
### Interpretation
This diagram demonstrates a process of iterative refinement in an AI-driven problem-solving scenario. The initial incorrect solution suggests the model may have started with an incomplete or flawed understanding of the problem. The subsequent rollouts, with their associated checkmarks and 'X' marks, illustrate the model's ability to learn and correct its mistakes. The model confidence score of 0.67 indicates a moderate level of certainty, suggesting that the model is not entirely confident in its final answer. The diagram could be used to evaluate the performance of an AI model on a specific task, or to illustrate the benefits of iterative refinement in problem-solving. The fact that the model eventually converges on the correct answer (24) is a positive sign, but the initial error and the relatively low confidence score suggest that further improvements may be needed. The diagram implies a reinforcement learning or similar iterative process where the model adjusts its approach based on feedback (the checkmarks and 'X' marks).