## Diagram: Mathematical Problem Solving with Multiple Rollouts
### Overview
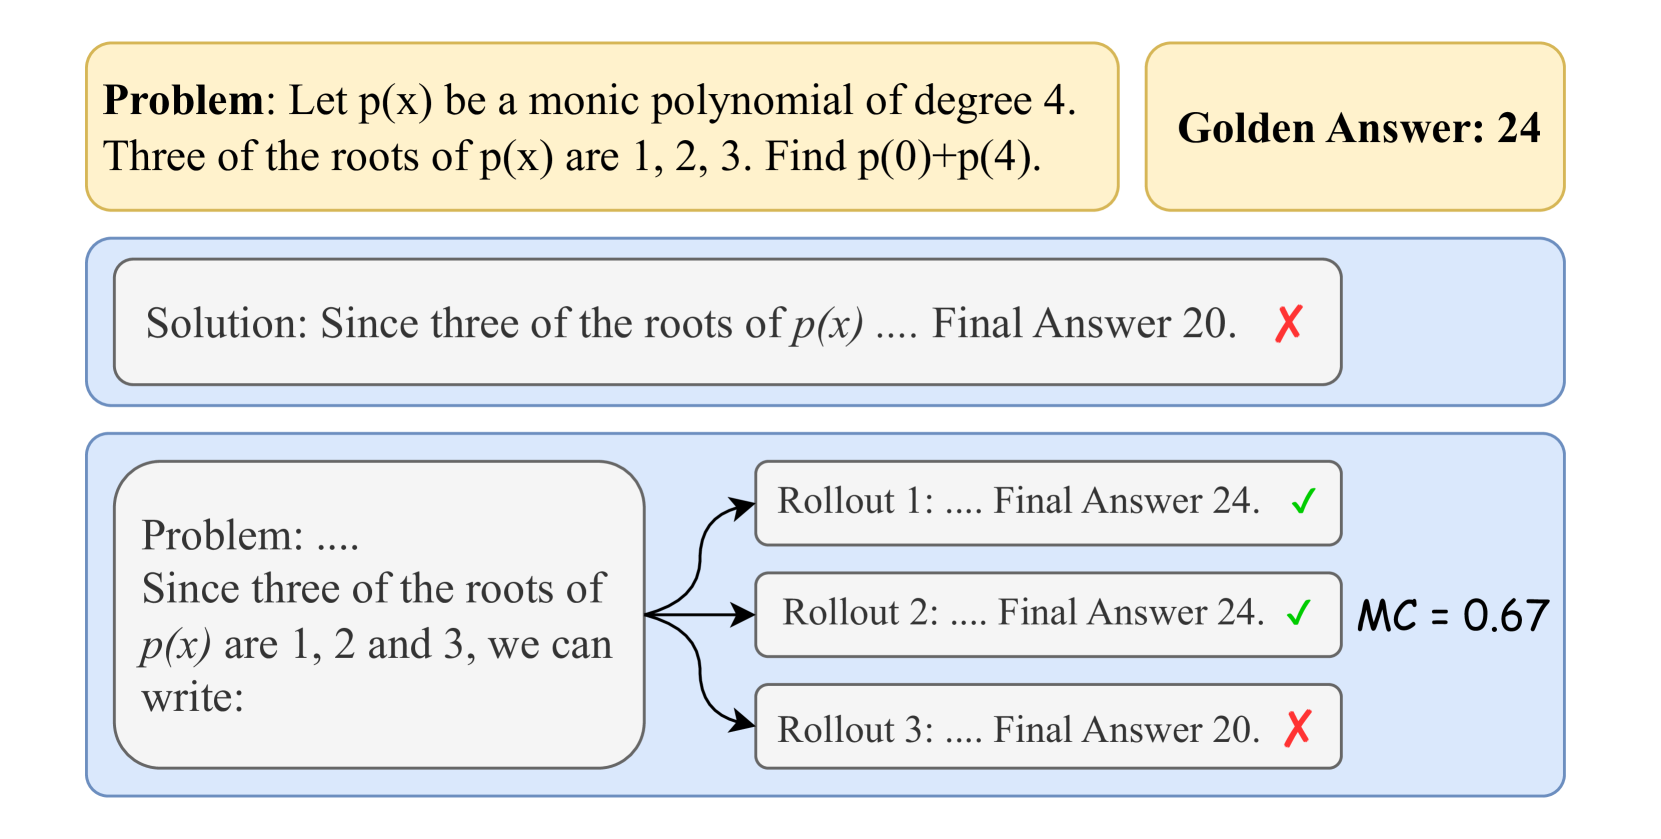
The image is a diagram illustrating a mathematical problem, one incorrect solution attempt, and a process of generating multiple solution attempts ("rollouts") with varying correctness. It includes the problem statement, a "Golden Answer," an incorrect solution, and a branching diagram showing three rollouts with a final accuracy metric.
### Components/Axes
The diagram is structured into three main horizontal sections against a light gray background.
1. **Top Section (Yellow Boxes):**
* **Left Box (Problem Statement):** Contains the text: "Problem: Let p(x) be a monic polynomial of degree 4. Three of the roots of p(x) are 1, 2, 3. Find p(0)+p(4)."
* **Right Box (Golden Answer):** Contains the text: "Golden Answer: 24"
2. **Middle Section (Blue Box with Incorrect Solution):**
* A single rounded rectangle containing the text: "Solution: Since three of the roots of p(x) .... Final Answer 20." A red "X" symbol is placed to the right of the text, indicating this answer is incorrect.
3. **Bottom Section (Blue Box with Rollout Diagram):**
* **Left Component (Problem Restatement):** A rounded rectangle containing the text: "Problem: .... Since three of the roots of p(x) are 1, 2 and 3, we can write:"
* **Right Components (Rollout Boxes):** Three separate rounded rectangles, each connected by an arrow originating from the left component.
* **Rollout 1 (Top):** Text: "Rollout 1: .... Final Answer 24." Followed by a green checkmark (✓).
* **Rollout 2 (Middle):** Text: "Rollout 2: .... Final Answer 24." Followed by a green checkmark (✓).
* **Rollout 3 (Bottom):** Text: "Rollout 3: .... Final Answer 20." Followed by a red "X".
* **Metric Label:** To the right of the three rollout boxes, the text "MC = 0.67" is displayed.
### Detailed Analysis
* **Problem:** The core task is to evaluate the expression `p(0) + p(4)` for a monic (leading coefficient of 1) degree-4 polynomial `p(x)`, given that three of its roots are 1, 2, and 3.
* **Golden Answer:** The provided correct answer is **24**.
* **Incorrect Solution:** A single solution attempt shown in the middle section concludes with "Final Answer 20," which is marked as incorrect.
* **Rollout Process:** The bottom diagram shows a process where the problem is restated, leading to three independent solution attempts ("rollouts").
* **Rollout 1 & 2:** Both correctly arrive at the answer **24** (marked with ✓).
* **Rollout 3:** Incorrectly arrives at the answer **20** (marked with X).
* **Performance Metric:** The label "MC = 0.67" is positioned to the right of the rollouts. Given the context of multiple attempts, "MC" likely stands for "Monte Carlo" or a similar confidence/agreement metric. The value 0.67 corresponds to the proportion of correct rollouts (2 out of 3).
### Key Observations
1. **Discrepancy in Answers:** There is a clear conflict between the "Golden Answer" (24) and the answer from the single incorrect solution (20). The rollout process demonstrates that both answers can be generated by the underlying system.
2. **Majority Correctness:** The rollout diagram shows that the correct answer (24) is produced more frequently (2 out of 3 times) than the incorrect answer (20).
3. **Metric Calculation:** The "MC = 0.67" metric directly quantifies the agreement or confidence based on the rollout results, calculated as 2/3 ≈ 0.67.
4. **Visual Coding:** Correctness is consistently indicated by green checkmarks (✓) and incorrectness by red "X" symbols throughout the diagram.
### Interpretation
This diagram appears to visualize the output of a **probabilistic or sampling-based problem-solving system**, such as a large language model using techniques like self-consistency or Monte Carlo tree search. The system generates multiple reasoning paths ("rollouts") for the same problem.
* **What it demonstrates:** The system is not deterministic; it can produce different final answers for the same input. The "Golden Answer" serves as the ground truth. The diagram shows that while the system can produce the correct answer, it is also susceptible to generating a specific incorrect answer (20).
* **How elements relate:** The top section establishes the problem and ground truth. The middle section shows a single failure case. The bottom section provides a more robust analysis by showing the distribution of outcomes from multiple attempts, culminating in a summary metric (MC=0.67) that reflects the system's confidence or reliability for this specific problem.
* **Notable implication:** The value "MC = 0.67" suggests that for this problem, the system has a ~67% chance of producing the correct answer in a single rollout, based on this sample of three. This highlights the importance of using multiple sampling and aggregation methods (like majority voting) to improve reliability in AI-based problem-solving, rather than relying on a single output. The specific incorrect answer "20" may point to a common logical or computational pitfall in the solution process for this polynomial problem.