## Bar Charts: Empirical Validation of Proposed Metrics
### Overview
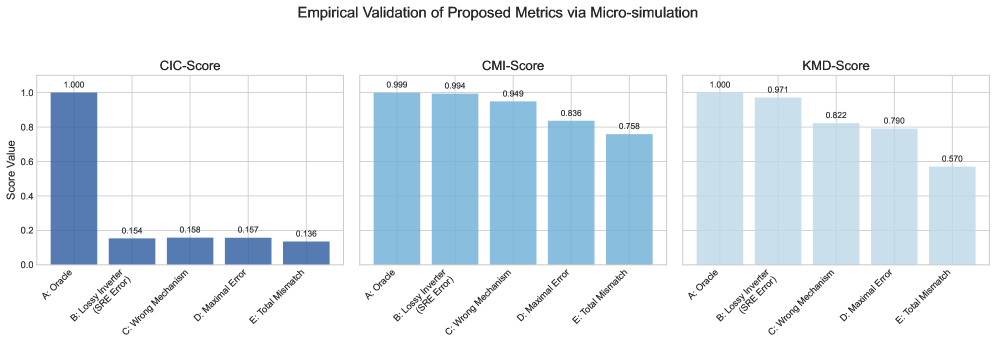
The image presents three bar charts comparing the performance of different metrics (CIC-Score, CMI-Score, and KMD-Score) under various error conditions. Each chart displays the score value for five scenarios: Oracle, Lossy Inverter (SRE Error), Wrong Mechanism, Maximal Error, and Total Mismatch. The y-axis represents the "Score Value," ranging from 0.0 to 1.0.
### Components/Axes
* **Title:** Empirical Validation of Proposed Metrics via Micro-simulation
* **Y-axis Title:** Score Value
* **Y-axis Scale:** 0.0 to 1.0, incrementing by 0.2.
* **X-axis Categories (shared across all charts):**
* A: Oracle
* B: Lossy Inverter (SRE Error)
* C: Wrong Mechanism
* D: Maximal Error
* E: Total Mismatch
* **Chart Titles:**
* CIC-Score (left)
* CMI-Score (center)
* KMD-Score (right)
### Detailed Analysis
**1. CIC-Score (Left Chart):**
* Color: Dark Blue
* Trend: The "Oracle" scenario has a score of 1.0, while the other scenarios have significantly lower scores.
* A: Oracle: 1.000
* B: Lossy Inverter (SRE Error): 0.154
* C: Wrong Mechanism: 0.168
* D: Maximal Error: 0.157
* E: Total Mismatch: 0.136
**2. CMI-Score (Center Chart):**
* Color: Light Blue
* Trend: The "Oracle" and "Lossy Inverter" scenarios have high scores, with a gradual decrease in scores for the remaining scenarios.
* A: Oracle: 0.999
* B: Lossy Inverter (SRE Error): 0.994
* C: Wrong Mechanism: 0.949
* D: Maximal Error: 0.836
* E: Total Mismatch: 0.758
**3. KMD-Score (Right Chart):**
* Color: Very Light Blue
* Trend: The "Oracle" and "Lossy Inverter" scenarios have high scores, with a more pronounced decrease in scores for the remaining scenarios compared to the CMI-Score chart.
* A: Oracle: 1.000
* B: Lossy Inverter (SRE Error): 0.971
* C: Wrong Mechanism: 0.822
* D: Maximal Error: 0.790
* E: Total Mismatch: 0.570
### Key Observations
* The "Oracle" scenario consistently achieves the highest score (1.0 or near 1.0) across all three metrics.
* The "Lossy Inverter (SRE Error)" scenario also performs well for CMI-Score and KMD-Score, but poorly for CIC-Score.
* The "Total Mismatch" scenario consistently has the lowest score among the error conditions for all three metrics.
* The CIC-Score shows a clear distinction between the "Oracle" and error scenarios, while CMI-Score and KMD-Score show a more gradual decline in performance across the error scenarios.
### Interpretation
The data suggests that the CIC-Score is highly sensitive to errors, as even minor deviations from the "Oracle" condition result in a significant drop in the score. In contrast, CMI-Score and KMD-Score are more robust to certain types of errors, particularly the "Lossy Inverter (SRE Error)." The consistent low performance of the "Total Mismatch" scenario across all metrics indicates that this type of error has the most detrimental impact on the system's performance.
The charts demonstrate the empirical validation of the proposed metrics by showing how they respond to different error conditions. The choice of which metric to use would depend on the specific application and the types of errors that are most likely to occur. If high sensitivity to any error is desired, CIC-Score might be preferred. If robustness to "Lossy Inverter" errors is important, CMI-Score or KMD-Score might be more suitable.