\n
## Bar Chart: Empirical Validation of Proposed Metrics via Micro-simulation
### Overview
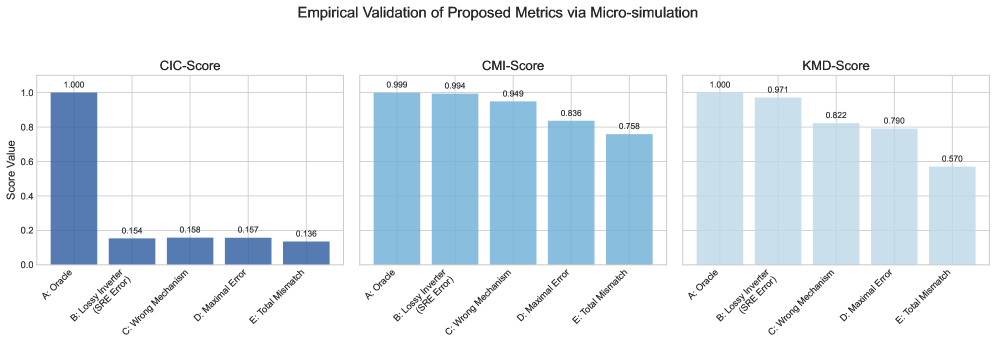
The image presents three bar charts, side-by-side, comparing the scores of three different metrics (CIC-Score, CMI-Score, and KMD-Score) across five different error types (A: Oracle, B: Lossy Inverter (SRE Error), C: Wrong Mechanism, D: Maximal Error, E: Total Mismatch). The y-axis represents the "Score Value", ranging from 0.0 to 1.0. The x-axis represents the error types.
### Components/Axes
* **Title:** "Empirical Validation of Proposed Metrics via Micro-simulation" (positioned at the top-center)
* **Y-axis Label:** "Score Value" (common to all three charts, positioned on the left side)
* **X-axis Labels (common to all three charts):**
* A: Oracle
* B: Lossy Inverter (SRE Error)
* C: Wrong Mechanism
* D: Maximal Error
* E: Total Mismatch
* **Chart Titles:**
* CIC-Score (left chart)
* CMI-Score (center chart)
* KMD-Score (right chart)
* **Color:** All bars are a shade of blue.
### Detailed Analysis or Content Details
**1. CIC-Score (Left Chart)**
* **Trend:** The CIC-Score shows a steep decline from A to B, then a gradual decline from B to E.
* **Data Points:**
* A: Oracle - 1.000
* B: Lossy Inverter (SRE Error) - 0.154
* C: Wrong Mechanism - 0.158
* D: Maximal Error - 0.157
* E: Total Mismatch - 0.136
**2. CMI-Score (Center Chart)**
* **Trend:** The CMI-Score starts high at A, decreases to B, then continues to decrease, but at a slower rate, towards E.
* **Data Points:**
* A: Oracle - 0.999
* B: Lossy Inverter (SRE Error) - 0.994
* C: Wrong Mechanism - 0.949
* D: Maximal Error - 0.836
* E: Total Mismatch - 0.758
**3. KMD-Score (Right Chart)**
* **Trend:** The KMD-Score starts at 1.0 for A, decreases to B, then decreases more rapidly from B to E.
* **Data Points:**
* A: Oracle - 1.000
* B: Lossy Inverter (SRE Error) - 0.971
* C: Wrong Mechanism - 0.822
* D: Maximal Error - 0.790
* E: Total Mismatch - 0.670
### Key Observations
* All three metrics achieve a perfect score (1.0) for the "Oracle" case (A).
* The "Lossy Inverter (SRE Error)" (B) causes the most significant drop in the CIC-Score, followed by the KMD-Score, and then the CMI-Score.
* The CMI-Score remains relatively high even for the "Total Mismatch" (E) error type, compared to the CIC-Score and KMD-Score.
* The CIC-Score consistently has the lowest values across all error types except for the Oracle case.
### Interpretation
The data suggests that the three metrics (CIC, CMI, and KMD) respond differently to various error types. The CIC-Score appears to be the most sensitive to the "Lossy Inverter (SRE Error)" and generally provides lower scores across the board, indicating it may be more conservative in its evaluation. The CMI-Score is the most robust, maintaining higher scores even in the presence of significant errors. The KMD-Score falls in between the two, showing a moderate sensitivity to the different error types.
The fact that all metrics achieve a perfect score for the "Oracle" case confirms their ability to correctly identify correct behavior. The differences in scores for the error types highlight the varying strengths and weaknesses of each metric in detecting and quantifying different types of errors. This information is valuable for selecting the most appropriate metric for a specific application or for combining multiple metrics to achieve a more comprehensive evaluation. The micro-simulation context suggests these metrics are being used to assess the performance of a system under controlled error conditions.