\n
## Bar Chart: Empirical Validation of Proposed Metrics via Micro-simulation
### Overview
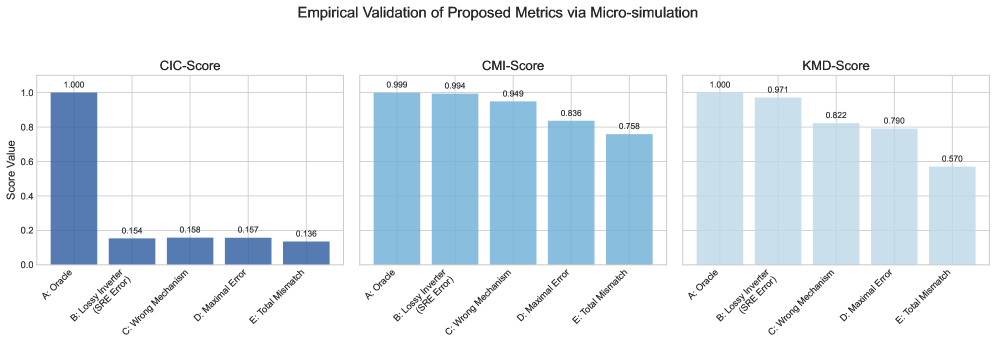
The image displays a set of three bar charts arranged horizontally, collectively titled "Empirical Validation of Proposed Metrics via Micro-simulation." Each chart represents the performance of a different proposed metric (CIC-Score, CMI-Score, KMD-Score) across five distinct test conditions or error scenarios. The charts use a consistent blue color palette and share a common y-axis scale.
### Components/Axes
* **Main Title:** "Empirical Validation of Proposed Metrics via Micro-simulation" (centered at the top).
* **Subplot Titles:** Three individual charts are labeled from left to right: "CIC-Score", "CMI-Score", and "KMD-Score".
* **Y-Axis (Common to all):**
* **Label:** "Scores Value"
* **Scale:** Linear scale from 0.0 to 1.0, with major tick marks at 0.0, 0.2, 0.4, 0.6, 0.8, and 1.0.
* **X-Axis (Common to all):** Five categorical conditions are listed identically on each chart. The labels are rotated approximately 45 degrees for readability.
* **Categories:**
1. A. Oracle
2. B. Logit Inverter (SRE Error)
3. C. Wrong Mechanism
4. D. Maximal Error
5. E. Total Mismatch
* **Data Representation:** Vertical bars. The numerical value for each bar is displayed directly above it.
* **Color Scheme:** All bars are shades of blue. The "Oracle" bar (Category A) is a darker, more saturated blue in the CIC-Score chart. The bars in the CMI-Score and KMD-Score charts are a lighter, more uniform blue. There is no separate legend; the categories are defined by the x-axis labels.
### Detailed Analysis
**1. CIC-Score Chart (Left)**
* **Trend:** The score is at its maximum for the Oracle condition and drops dramatically for all error conditions, which have relatively similar, low scores.
* **Data Points:**
* A. Oracle: 1.000
* B. Logit Inverter (SRE Error): 0.154
* C. Wrong Mechanism: 0.158
* D. Maximal Error: 0.157
* E. Total Mismatch: 0.136
**2. CMI-Score Chart (Center)**
* **Trend:** The score starts very high for the Oracle and Logit Inverter conditions, then shows a gradual, stepwise decline across the subsequent error conditions.
* **Data Points:**
* A. Oracle: 0.999
* B. Logit Inverter (SRE Error): 0.994
* C. Wrong Mechanism: 0.949
* D. Maximal Error: 0.836
* E. Total Mismatch: 0.758
**3. KMD-Score Chart (Right)**
* **Trend:** Similar to CMI-Score, it starts high for Oracle and Logit Inverter, then declines. The decline appears more pronounced after the "Wrong Mechanism" condition compared to the CMI-Score chart.
* **Data Points:**
* A. Oracle: 1.000
* B. Logit Inverter (SRE Error): 0.971
* C. Wrong Mechanism: 0.822
* D. Maximal Error: 0.790
* E. Total Mismatch: 0.570
### Key Observations
1. **Oracle Baseline:** All three metrics achieve near-perfect scores (≈1.0) for the "A. Oracle" condition, establishing it as the ideal baseline.
2. **Metric Sensitivity:** The metrics respond very differently to errors.
* **CIC-Score** is extremely sensitive, showing a catastrophic drop (>84%) for *any* error condition, with little discrimination between error types.
* **CMI-Score** and **KMD-Score** are more graduated. They are robust to the "Logit Inverter (SRE Error)" (scores >0.97) but show increasing sensitivity to more severe errors like "Wrong Mechanism," "Maximal Error," and "Total Mismatch."
3. **Error Hierarchy:** The data suggests a hierarchy of error severity as perceived by the CMI and KMD metrics: Logit Inverter Error < Wrong Mechanism ≈ Maximal Error < Total Mismatch. The CIC metric does not differentiate between these.
4. **Worst-Case Performance:** The "E. Total Mismatch" condition results in the lowest score for all three metrics, with KMD-Score showing the most severe degradation (0.570).
### Interpretation
This visualization validates the behavior of three proposed evaluation metrics under controlled, simulated error conditions. The "Oracle" represents a perfect model or ground truth, serving as the control.
The **CIC-Score** appears to be a strict, binary-like metric. It effectively flags the *presence* of any deviation from the oracle but is insensitive to the *type or magnitude* of the error. It could be useful as a simple "pass/fail" check.
The **CMI-Score** and **KMD-Score** function as more nuanced, continuous metrics. They demonstrate a desirable property: they maintain high scores for minor or specific errors (like the SRE Error in the Logit Inverter) while progressively penalizing more fundamental flaws in the mechanism or complete mismatches. This graduated response makes them more informative for diagnosing the severity of model misspecification.
The stark difference between the CIC pattern and the CMI/KMD patterns suggests they are measuring different aspects of model performance or error. The CMI and KMD metrics seem better suited for comparative analysis where distinguishing between levels of error is important, while the CIC metric is a robust detector of any non-oracle behavior. The "Total Mismatch" condition serves as a stress test, revealing the limits of all metrics, with KMD-Score being the most severely impacted.