## Heatmap: AUROC for Projections a^Tt
### Overview
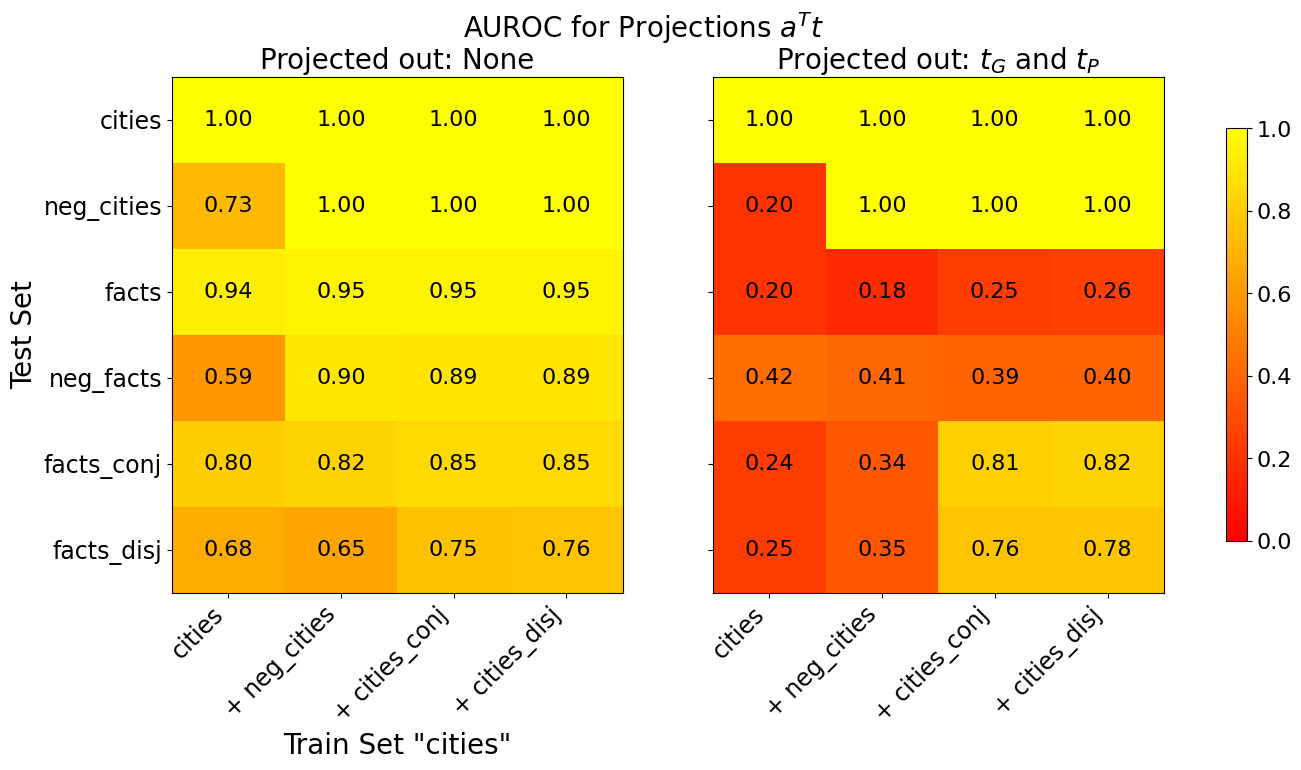
The image presents two heatmaps comparing the Area Under the Receiver Operating Characteristic Curve (AUROC) for different projection methods. The left heatmap shows results when no projections are used ("Projected out: None"), while the right heatmap shows results when projections tG and tP are used ("Projected out: tG and tP"). The heatmaps compare performance across various test sets and training sets, with the training set fixed as "cities". The color intensity represents the AUROC score, ranging from 0.0 (dark red) to 1.0 (yellow).
### Components/Axes
* **Title:** AUROC for Projections a^Tt
* **Y-axis (Test Set):**
* cities
* neg\_cities
* facts
* neg\_facts
* facts\_conj
* facts\_disj
* **X-axis (Train Set):** "cities"
* cities
* \+ neg\_cities
* \+ cities\_conj
* \+ cities\_disj
* **Heatmap 1 Title:** Projected out: None
* **Heatmap 2 Title:** Projected out: tG and tP
* **Colorbar:** Ranges from 0.0 (dark red) to 1.0 (yellow), with increments of 0.2.
### Detailed Analysis
**Heatmap 1: Projected out: None**
| Test Set | cities | + neg\_cities | + cities\_conj | + cities\_disj |
| :---------- | :----- | :------------- | :------------- | :------------- |
| cities | 1.00 | 1.00 | 1.00 | 1.00 |
| neg\_cities | 0.73 | 1.00 | 1.00 | 1.00 |
| facts | 0.94 | 0.95 | 0.95 | 0.95 |
| neg\_facts | 0.59 | 0.90 | 0.89 | 0.89 |
| facts\_conj | 0.80 | 0.82 | 0.85 | 0.85 |
| facts\_disj | 0.68 | 0.65 | 0.75 | 0.76 |
**Heatmap 2: Projected out: tG and tP**
| Test Set | cities | + neg\_cities | + cities\_conj | + cities\_disj |
| :---------- | :----- | :------------- | :------------- | :------------- |
| cities | 1.00 | 1.00 | 1.00 | 1.00 |
| neg\_cities | 0.20 | 1.00 | 1.00 | 1.00 |
| facts | 0.20 | 0.18 | 0.25 | 0.26 |
| neg\_facts | 0.42 | 0.41 | 0.39 | 0.40 |
| facts\_conj | 0.24 | 0.34 | 0.81 | 0.82 |
| facts\_disj | 0.25 | 0.35 | 0.76 | 0.78 |
### Key Observations
* When no projections are used, the AUROC scores are generally high, especially when the test set includes "cities" or "neg\_cities".
* When projections tG and tP are used, the AUROC scores drop significantly for most test sets when trained on "cities" or "+ neg\_cities", except for the "cities" test set itself.
* The "facts\_conj" and "facts\_disj" test sets show relatively better performance with projections tG and tP when trained on "+ cities\_conj" and "+ cities\_disj".
### Interpretation
The heatmaps illustrate the impact of projecting out tG and tP on the AUROC performance. The significant drop in AUROC scores when using these projections suggests that tG and tP contain information relevant to discriminating between positive and negative examples in most test sets, except when the test set is "cities". The improved performance of "facts\_conj" and "facts\_disj" when trained on "+ cities\_conj" and "+ cities\_disj" with projections suggests that these training sets may be more robust to the removal of tG and tP. The data suggests that the choice of projection significantly affects the model's ability to generalize across different test sets.
```