## Heatmap: AUROC for Projections Aᵀt
### Overview
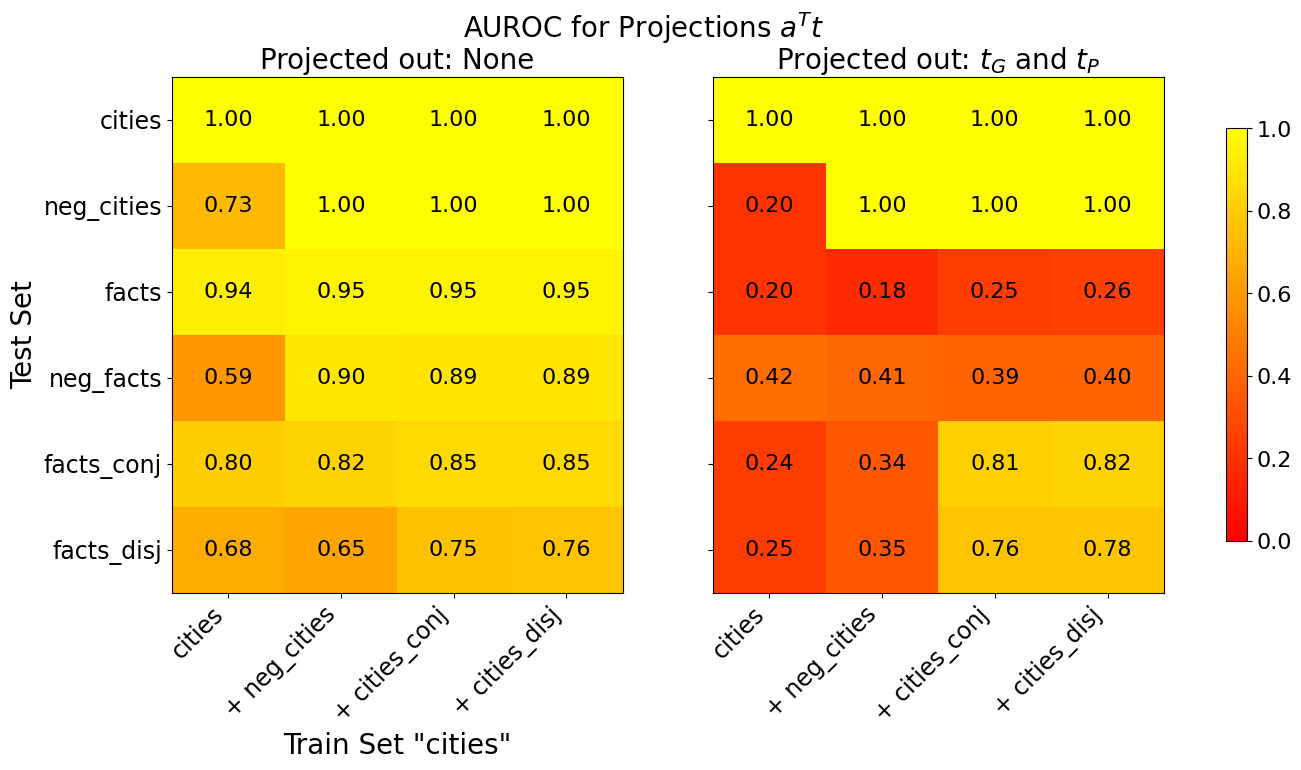
The image presents two heatmaps displaying Area Under the Receiver Operating Characteristic curve (AUROC) values for different combinations of train and test sets. The heatmaps compare performance under two projection scenarios: "Projected out: None" and "Projected out: τ<sub>G</sub> and τ<sub>P</sub>". Both heatmaps share the same train and test set categories. The color scale ranges from red (low AUROC, approximately 0.0) to yellow (high AUROC, approximately 1.0).
### Components/Axes
* **Title:** "AUROC for Projections Aᵀt" - positioned at the top-center.
* **Subtitles:** "Projected out: None" (left heatmap) and "Projected out: τ<sub>G</sub> and τ<sub>P</sub>" (right heatmap) - positioned directly below the main title, aligned with each heatmap.
* **X-axis (Train Set):** Labeled "Train Set 'cities'". Categories are: "cities", "+ neg\_cities", "+ cities\_conj", "+ cities\_disj".
* **Y-axis (Test Set):** Categories are: "cities", "neg\_cities", "facts", "neg\_facts", "facts\_conj", "facts\_disj".
* **Color Legend:** Located on the right side of the image. Ranges from red (0.0) to yellow (1.0). The legend is shared between both heatmaps.
### Detailed Analysis or Content Details
**Heatmap 1: Projected out: None**
This heatmap shows generally high AUROC values.
* **cities vs. cities:** 1.00
* **cities vs. + neg\_cities:** 1.00
* **cities vs. + cities\_conj:** 1.00
* **cities vs. + cities\_disj:** 1.00
* **neg\_cities vs. cities:** 0.73
* **neg\_cities vs. + neg\_cities:** 1.00
* **neg\_cities vs. + cities\_conj:** 1.00
* **neg\_cities vs. + cities\_disj:** 1.00
* **facts vs. cities:** 0.94
* **facts vs. + neg\_cities:** 0.95
* **facts vs. + cities\_conj:** 0.95
* **facts vs. + cities\_disj:** 0.95
* **neg\_facts vs. cities:** 0.59
* **neg\_facts vs. + neg\_cities:** 0.90
* **neg\_facts vs. + cities\_conj:** 0.89
* **neg\_facts vs. + cities\_disj:** 0.89
* **facts\_conj vs. cities:** 0.80
* **facts\_conj vs. + neg\_cities:** 0.82
* **facts\_conj vs. + cities\_conj:** 0.85
* **facts\_conj vs. + cities\_disj:** 0.85
* **facts\_disj vs. cities:** 0.68
* **facts\_disj vs. + neg\_cities:** 0.65
* **facts\_disj vs. + cities\_conj:** 0.75
* **facts\_disj vs. + cities\_disj:** 0.76
**Heatmap 2: Projected out: τ<sub>G</sub> and τ<sub>P</sub>**
This heatmap shows significantly lower AUROC values, particularly in the lower-left quadrant.
* **cities vs. cities:** 1.00
* **cities vs. + neg\_cities:** 1.00
* **cities vs. + cities\_conj:** 1.00
* **cities vs. + cities\_disj:** 1.00
* **neg\_cities vs. cities:** 0.20
* **neg\_cities vs. + neg\_cities:** 1.00
* **neg\_cities vs. + cities\_conj:** 1.00
* **neg\_cities vs. + cities\_disj:** 1.00
* **facts vs. cities:** 0.20
* **facts vs. + neg\_cities:** 0.18
* **facts vs. + cities\_conj:** 0.25
* **facts vs. + cities\_disj:** 0.26
* **neg\_facts vs. cities:** 0.42
* **neg\_facts vs. + neg\_cities:** 0.41
* **neg\_facts vs. + cities\_conj:** 0.39
* **neg\_facts vs. + cities\_disj:** 0.40
* **facts\_conj vs. cities:** 0.24
* **facts\_conj vs. + neg\_cities:** 0.34
* **facts\_conj vs. + cities\_conj:** 0.81
* **facts\_conj vs. + cities\_disj:** 0.82
* **facts\_disj vs. cities:** 0.25
* **facts\_disj vs. + neg\_cities:** 0.35
* **facts\_disj vs. + cities\_conj:** 0.76
* **facts\_disj vs. + cities\_disj:** 0.78
### Key Observations
* The "Projected out: None" heatmap consistently shows high AUROC values (close to 1.0) across most train/test set combinations.
* The "Projected out: τ<sub>G</sub> and τ<sub>P</sub>" heatmap exhibits significantly lower AUROC values, especially when the test set includes "facts" or "neg\_facts".
* The performance drop is most pronounced when testing against "neg\_cities" and "facts" with the "cities" training set.
* Adding "conj" or "disj" to the training set generally improves performance in the "Projected out: τ<sub>G</sub> and τ<sub>P</sub>" scenario, but not enough to reach the levels seen in the "Projected out: None" scenario.
### Interpretation
The data suggests that projecting out τ<sub>G</sub> and τ<sub>P</sub> significantly degrades the model's ability to distinguish between different categories, particularly when dealing with factual information. The high AUROC values in the "Projected out: None" scenario indicate that the original projections (Aᵀt) contain information crucial for accurate classification. The substantial performance drop when projecting out τ<sub>G</sub> and τ<sub>P</sub> implies that these projections are essential for capturing the relevant features for distinguishing between "cities", "facts", and their variations.
The improvement observed when adding "conj" or "disj" to the training set in the second heatmap suggests that these features provide some additional discriminatory power, but they are not sufficient to compensate for the loss of information caused by the projection. The heatmap highlights the importance of the specific projections used and their impact on model performance. The difference between the two heatmaps is striking, indicating that the choice of projection method has a substantial effect on the model's ability to generalize.