TECHNICAL ASSET FINGERPRINT
1f9727e75a34801ed7e98fe9
Click to view fullscreen
Press ESC or click to close
FOUND IN PAPERS
EXPERT: healer-alpha-free VERSION 1
RUNTIME: free/openrouter/healer-alpha
INTEL_VERIFIED
\n
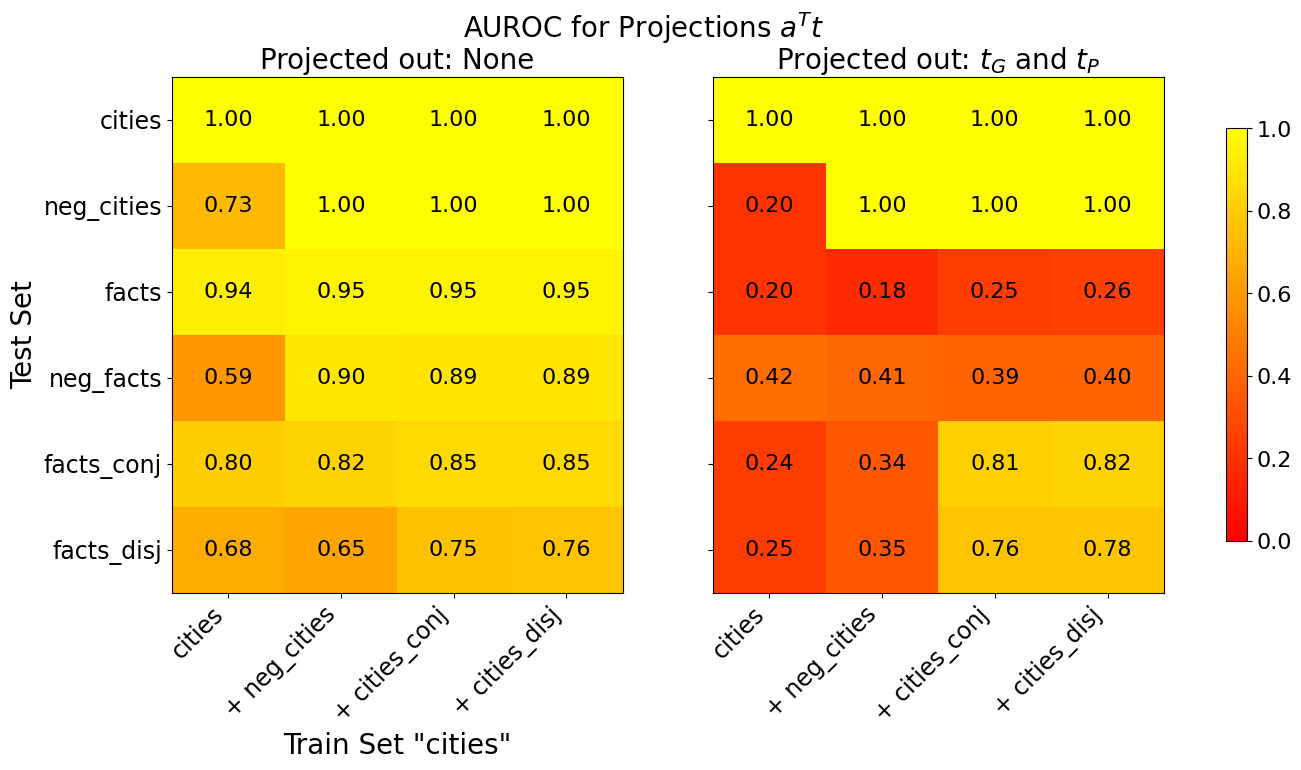
## Heatmap Chart: AUROC for Projections a^T t
### Overview
The image displays two side-by-side heatmaps comparing AUROC (Area Under the Receiver Operating Characteristic curve) scores for a projection method denoted as `a^T t`. The comparison is between two conditions: "Projected out: None" (left heatmap) and "Projected out: t_G and t_P" (right heatmap). The heatmaps visualize performance across different combinations of training and test datasets related to "cities" and "facts".
### Components/Axes
* **Main Title:** "AUROC for Projections a^T t"
* **Left Heatmap Subtitle:** "Projected out: None"
* **Right Heatmap Subtitle:** "Projected out: t_G and t_P"
* **Y-axis (Both Heatmaps):** Label: "Test Set". Categories (from top to bottom): `cities`, `neg_cities`, `facts`, `neg_facts`, `facts_conj`, `facts_disj`.
* **X-axis (Both Heatmaps):** Label: "Train Set 'cities'". Categories (from left to right): `cities`, `+ neg_cities`, `+ cities_conj`, `+ cities_disj`.
* **Color Scale (Right Side):** A vertical color bar ranging from 0.0 (dark red) to 1.0 (bright yellow). The scale is linear with tick marks at 0.0, 0.2, 0.4, 0.6, 0.8, and 1.0. This scale applies to both heatmaps.
* **Data Representation:** Each cell in the 6x4 grids contains a numerical AUROC value (to two decimal places) and is colored according to the scale. Yellow indicates high performance (~1.0), orange/red indicates lower performance.
### Detailed Analysis
**Left Heatmap: Projected out: None**
* **Test Set `cities`:** All training set combinations yield a perfect AUROC of **1.00** (bright yellow).
* **Test Set `neg_cities`:** Performance is perfect (1.00) for all training sets except the baseline `cities` training set, which scores **0.73** (orange).
* **Test Set `facts`:** Scores are consistently high, ranging from **0.94** to **0.95** (yellow) across all training sets.
* **Test Set `neg_facts`:** The baseline `cities` training set scores **0.59** (orange). Adding other datasets (`+ neg_cities`, `+ cities_conj`, `+ cities_disj`) improves performance significantly to **0.89-0.90** (yellow).
* **Test Set `facts_conj`:** Scores range from **0.80** to **0.85** (yellow-orange), showing a slight upward trend as more data is added to the training set.
* **Test Set `facts_disj`:** Scores range from **0.65** to **0.76** (orange), also showing a general upward trend with more training data.
**Right Heatmap: Projected out: t_G and t_P**
* **Test Set `cities`:** All training set combinations still yield a perfect AUROC of **1.00** (bright yellow).
* **Test Set `neg_cities`:** Performance collapses for the baseline `cities` training set to **0.20** (dark red). However, adding `neg_cities` or other datasets to the training set restores perfect performance (**1.00**, yellow).
* **Test Set `facts`:** Performance is severely degraded across all training sets, with scores between **0.18** and **0.26** (dark red/orange).
* **Test Set `neg_facts`:** Scores are low, ranging from **0.39** to **0.42** (red/orange), with minimal variation across training sets.
* **Test Set `facts_conj`:** Shows a dramatic split. The baseline and `+ neg_cities` training sets score poorly (**0.24, 0.34** - red/orange). However, adding `cities_conj` or `cities_disj` to the training set results in high performance (**0.81, 0.82** - yellow).
* **Test Set `facts_disj`:** Similar pattern to `facts_conj`. Low scores for baseline and `+ neg_cities` training sets (**0.25, 0.35** - red/orange), but high scores when `cities_conj` or `cities_disj` are added (**0.76, 0.78** - yellow).
### Key Observations
1. **Perfect Performance on `cities`:** The `cities` test set achieves a perfect 1.00 AUROC under all conditions, indicating the projection does not affect this specific evaluation.
2. **Catastrophic Drop for `facts`:** Projecting out `t_G` and `t_P` causes a massive performance drop for the `facts` test set (from ~0.95 to ~0.20), suggesting these components are critical for generalizing to factual statements.
3. **Conditional Recovery for `neg_cities` and Logical Forms:** For `neg_cities`, `facts_conj`, and `facts_disj`, the negative impact of projection is **only observed when the training set is the basic `cities` set**. Adding relevant data (`neg_cities`, `cities_conj`, `cities_disj`) to the training set restores high performance, even after projection.
4. **Training Set Composition Matters:** The benefit of adding data to the training set is far more pronounced in the "Projected out" condition. For example, moving from `cities` to `+ cities_conj` training set improves the `facts_conj` test score from 0.24 to 0.81 in the right heatmap, a much larger gain than in the left heatmap (0.80 to 0.85).
### Interpretation
This chart investigates the role of specific model components (`t_G` and `t_P`) in a projection-based evaluation framework (`a^T t`). The data suggests:
* **`t_G` and `t_P` are essential for broad generalization:** Their removal ("projected out") devastates performance on the `facts` test set, implying these components encode general knowledge or reasoning capabilities necessary for handling factual statements not seen during training on "cities" data.
* **Specialized knowledge can compensate:** The model can still perform well on structured negations (`neg_cities`) and logical combinations (`facts_conj`, `facts_disj`) **if** it has been trained on analogous examples. This indicates that while `t_G`/`t_P` provide a general foundation, task-specific patterns can be learned directly from data.
* **The projection isolates a specific capability:** The "Projected out: None" condition likely represents the model's full capability. Projecting out `t_G` and `t_P` isolates the performance attributable to other components. The stark contrast shows that for some tasks (`facts`), the projected components are the sole source of performance, while for others (`cities`, trained `neg_cities`), performance is robust and resides elsewhere in the model.
* **Investigative Insight:** The experiment design probes the model's "knowledge" structure. It distinguishes between knowledge that is **general and transferable** (likely in `t_G`/`t_P`, needed for `facts`) and knowledge that is **specific and learnable from correlated data** (e.g., learning about `neg_cities` from `cities` and `neg_cities` examples). The heatmap provides a clear visual map of where the model's capabilities reside under different architectural constraints.
DECODING INTELLIGENCE...