## Heatmap: AUROC for Projections a^Tt
### Overview
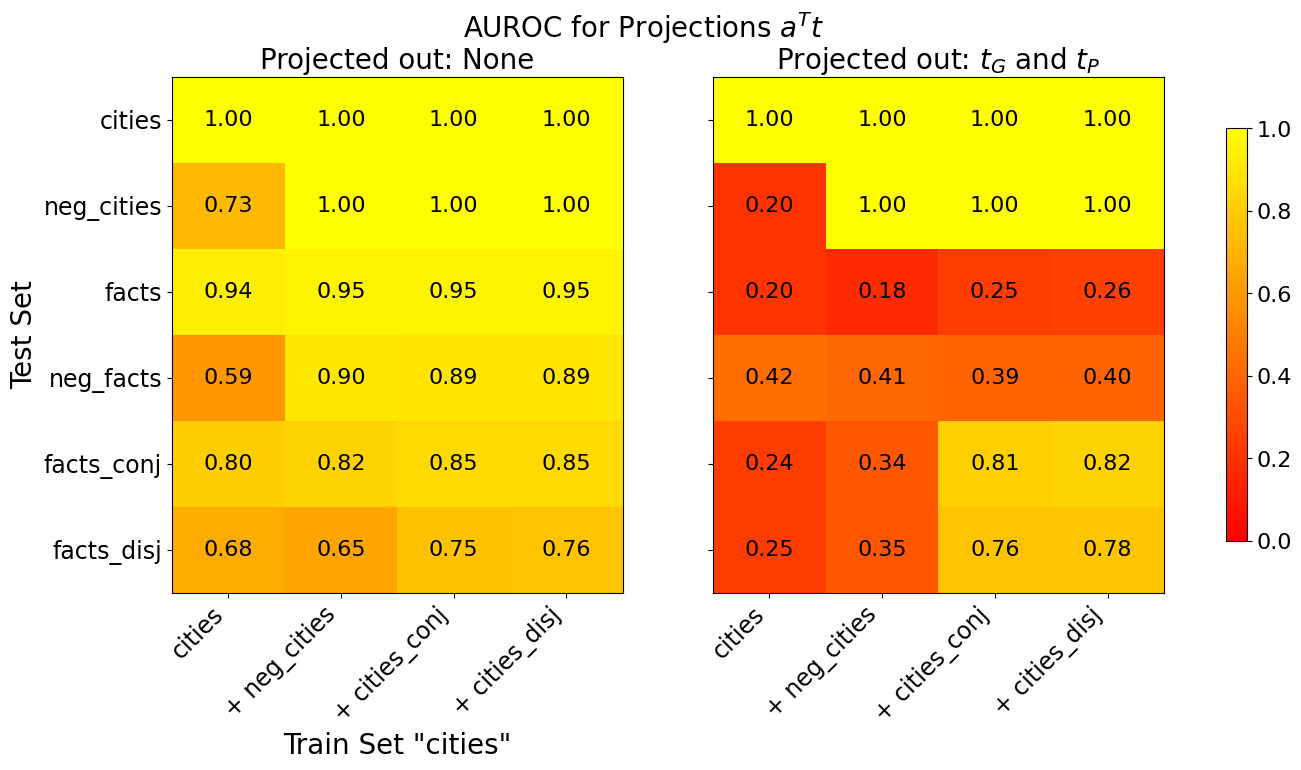
The image presents two side-by-side heatmaps comparing Area Under the Receiver Operating Characteristic (AUROC) values for model projections under two scenarios: (1) no variables projected out, and (2) variables `t_G` and `t_P` projected out. The heatmaps evaluate performance across six test sets and four train sets, with values ranging from 0.0 (red) to 1.0 (yellow).
---
### Components/Axes
- **X-axis (Train Set "cities")**:
Categories:
1. `cities`
2. `+ neg_cities`
3. `+ cities_conj`
4. `+ cities_disj`
- **Y-axis (Test Set)**:
Categories:
1. `cities`
2. `neg_cities`
3. `facts`
4. `neg_facts`
5. `facts_conj`
6. `facts_disj`
- **Color Legend**:
Gradient from red (0.0) to yellow (1.0), positioned on the right of both heatmaps.
---
### Detailed Analysis
#### Left Heatmap (Projected out: None)
- **Diagonal Values** (same test/train sets):
- `cities`: 1.00
- `neg_cities`: 0.73
- `facts`: 0.94
- `neg_facts`: 0.59
- `facts_conj`: 0.80
- `facts_disj`: 0.68
- **Off-Diagonal Trends**:
- `cities` vs. `neg_cities`: 0.73 (lowest in this quadrant).
- `facts` vs. `neg_facts`: 0.90 (high agreement).
- `facts_conj` vs. `cities_conj`: 0.85 (strong performance).
#### Right Heatmap (Projected out: `t_G` and `t_P`)
- **Diagonal Values**:
- `cities`: 0.20 (sharp drop from 1.00).
- `neg_cities`: 1.00 (unchanged).
- `facts`: 0.18 (dramatic decline).
- `neg_facts`: 0.41 (moderate drop).
- `facts_conj`: 0.24 (lowest in this quadrant).
- `facts_disj`: 0.25 (similar to `facts_conj`).
- **Off-Diagonal Trends**:
- `neg_cities` vs. `cities_conj`: 0.81 (highest in this quadrant).
- `facts_disj` vs. `cities_disj`: 0.78 (relatively stable).
---
### Key Observations
1. **Projection Impact**:
- Projecting out `t_G` and `t_P` reduces AUROC values by ~80% for `cities` and `facts` test sets.
- `neg_cities` and `neg_facts` test sets show resilience to projection, maintaining higher values.
2. **Train-Test Consistency**:
- When test and train sets match (diagonal), performance is highest in the "no projection" scenario.
- Mismatched sets (e.g., `facts` test vs. `cities` train) show lower values, especially after projection.
3. **Color Correlation**:
- Yellow dominates the left heatmap (high AUROC), while red dominates the right (low AUROC).
---
### Interpretation
- **Model Sensitivity**: The drastic drop in AUROC when projecting out `t_G` and `t_P` suggests these variables are critical for model performance, particularly for `cities` and `facts` test sets.
- **Robustness**: `neg_cities` and `neg_facts` test sets are less affected by projection, indicating they may rely on different features or are inherently more robust.
- **Generalization Gap**: The disparity between matched and mismatched train-test sets highlights overfitting risks, exacerbated by variable projection.
This analysis underscores the importance of retaining key variables (`t_G`, `t_P`) for accurate projections and highlights trade-offs between model specificity and generalization.