## Diagram: Abductive Reasoning Process
### Overview
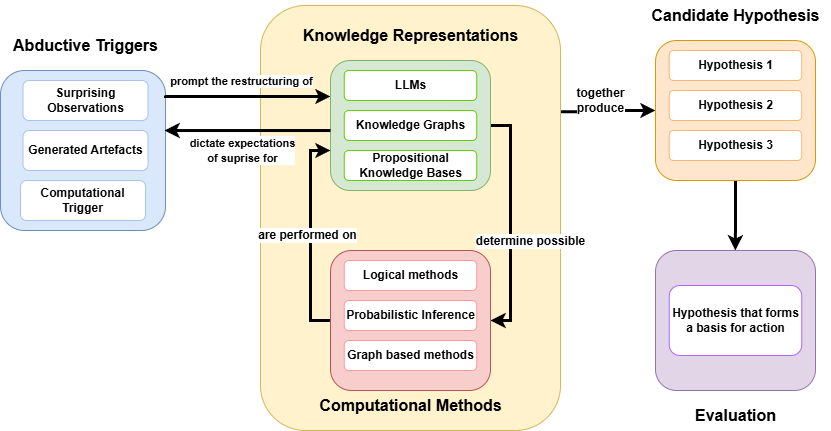
The image is a diagram illustrating an abductive reasoning process. It shows the flow of information and the relationships between different components, including abductive triggers, knowledge representations, computational methods, candidate hypotheses, and evaluation.
### Components/Axes
* **Abductive Triggers** (Blue box, top-left): Contains "Surprising Observations", "Generated Artefacts", and "Computational Trigger".
* **Knowledge Representations** (Yellow rounded box, center): Contains "LLMs", "Knowledge Graphs", and "Propositional Knowledge Bases" (all in green boxes).
* **Computational Methods** (Red rounded box, center-bottom): Contains "Logical methods", "Probabilistic Inference", and "Graph based methods" (all in red boxes).
* **Candidate Hypothesis** (Orange rounded box, top-right): Contains "Hypothesis 1", "Hypothesis 2", and "Hypothesis 3" (all in orange boxes).
* **Evaluation** (Purple rounded box, bottom-right): Contains "Hypothesis that forms a basis for action" (in a purple box).
* **Arrows**: Indicate the flow of information and relationships between the components.
* An arrow from "Abductive Triggers" to "Knowledge Representations" is labeled "prompt the restructuring of".
* An arrow from "Knowledge Representations" to "Abductive Triggers" is labeled "dictate expectations of surprise for".
* An arrow from "Knowledge Representations" to "Candidate Hypothesis" is labeled "together produce".
* An arrow from "Computational Methods" to "Knowledge Representations" is labeled "are performed on".
* An arrow from "Computational Methods" to "Candidate Hypothesis" is labeled "determine possible".
* An arrow from "Candidate Hypothesis" to "Evaluation" is unlabeled.
### Detailed Analysis or Content Details
* **Abductive Triggers**:
* Surprising Observations: Represents unexpected or anomalous data that initiates the reasoning process.
* Generated Artefacts: Refers to new data or information created during the reasoning process.
* Computational Trigger: Represents a computational event that initiates the reasoning process.
* **Knowledge Representations**:
* LLMs: Refers to Large Language Models.
* Knowledge Graphs: Represents structured knowledge in the form of nodes and edges.
* Propositional Knowledge Bases: Represents knowledge in the form of logical propositions.
* **Computational Methods**:
* Logical methods: Refers to methods based on formal logic.
* Probabilistic Inference: Refers to methods for reasoning under uncertainty.
* Graph based methods: Refers to methods that utilize graph structures for computation.
* **Candidate Hypothesis**:
* Hypothesis 1, Hypothesis 2, Hypothesis 3: Represents different possible explanations or solutions.
* **Evaluation**:
* Hypothesis that forms a basis for action: Represents the selected hypothesis that is used for decision-making or action.
### Key Observations
* The diagram illustrates a cyclical process where abductive triggers initiate the restructuring of knowledge representations.
* Knowledge representations and computational methods work together to generate candidate hypotheses.
* The evaluation stage selects a hypothesis for action.
### Interpretation
The diagram depicts a high-level overview of abductive reasoning, a form of logical inference that starts with an observation and then seeks to find the simplest and most likely explanation. The process begins with "Abductive Triggers" that prompt the system to restructure its "Knowledge Representations". These representations, along with "Computational Methods", are used to generate "Candidate Hypotheses". Finally, the hypotheses are evaluated, and one is selected as the basis for action. The cycle suggests a continuous refinement of knowledge and hypotheses based on new observations and computational methods. The feedback loop between "Knowledge Representations" and "Abductive Triggers" indicates that expectations are adjusted based on the outcomes of the reasoning process.