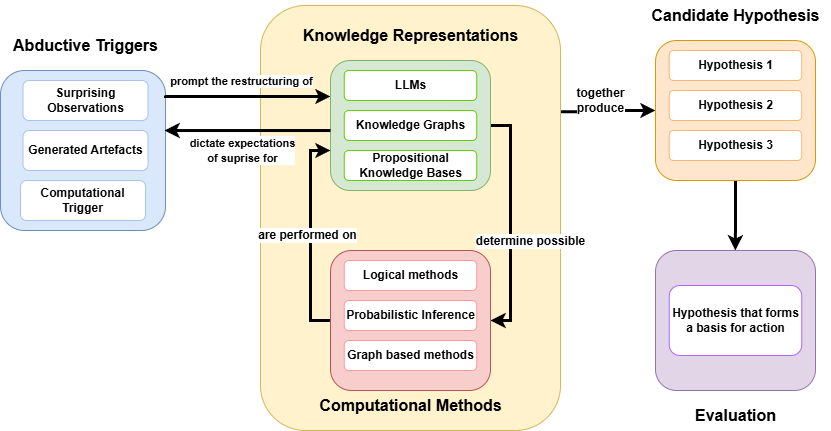
## Diagram: Abductive Reasoning and Hypothesis Generation Framework
### Overview
The image is a technical flowchart illustrating a system architecture or cognitive framework for abductive reasoning. It details the cyclical and linear processes by which anomalous inputs ("triggers") interact with existing knowledge bases and computational engines to generate, and subsequently evaluate, actionable hypotheses.
### Components and Spatial Grounding
The diagram is divided into four primary spatial regions, each color-coded and containing specific sub-elements:
1. **Left Region (Light Blue):** "Abductive Triggers"
2. **Center Region (Pale Yellow Background):** A central processing hub containing "Knowledge Representations" (Light Green) and "Computational Methods" (Light Pink).
3. **Top-Right Region (Light Orange):** "Candidate Hypothesis"
4. **Bottom-Right Region (Light Purple):** "Evaluation"
### Content Details and Flow Analysis
#### 1. Abductive Triggers (Left Region)
* **Visuals:** A light blue container with rounded corners.
* **Header Text:** `Abductive Triggers`
* **Contained Elements (White boxes):**
* `Surprising Observations`
* `Generated Artefacts`
* `Computational Trigger`
#### 2. Central Processing Hub (Center Region)
This region is bounded by a large pale yellow box with rounded corners. It contains two distinct sub-systems that interact with each other.
* **Top Sub-system (Light Green):**
* **Header Text:** `Knowledge Representations`
* **Contained Elements (White boxes):**
* `LLMs` (Large Language Models)
* `Knowledge Graphs`
* `Propositional Knowledge Bases`
* **Bottom Sub-system (Light Pink):**
* **Footer Text:** `Computational Methods`
* **Contained Elements (White boxes):**
* `Logical methods`
* `Probabilistic Inference`
* `Graph based methods`
* **Internal Flow (Vertical):**
* A downward-pointing arrow from the Green box to the Pink box is labeled: `determine possible`.
* An upward-pointing arrow from the Pink box to the Green box is labeled: `are performed on`.
#### 3. Candidate Hypothesis (Top-Right Region)
* **Visuals:** A light orange container with rounded corners.
* **Header Text:** `Candidate Hypothesis`
* **Contained Elements (White boxes):**
* `Hypothesis 1`
* `Hypothesis 2`
* `Hypothesis 3`
#### 4. Evaluation (Bottom-Right Region)
* **Visuals:** A light purple container with rounded corners.
* **Footer Text:** `Evaluation`
* **Contained Elements (White box):**
* `Hypothesis that forms a basis for action`
#### 5. External System Flows (Connecting the Regions)
* **Trigger to Knowledge (Left to Center):** A right-pointing arrow connects the "Abductive Triggers" box to the "Knowledge Representations" box.
* **Label:** `prompt the restructuring of`
* **Knowledge to Trigger (Center to Left):** A left-pointing arrow connects the "Knowledge Representations" box back to the "Abductive Triggers" box.
* **Label:** `dictate expectations of suprise for` *(Note: "surprise" is misspelled as "suprise" in the source image).*
* **Processing to Hypothesis (Center to Top-Right):** A right-pointing arrow originates from the edge of the central yellow box and points to the "Candidate Hypothesis" box.
* **Label:** `together produce`
* **Hypothesis to Evaluation (Top-Right to Bottom-Right):** A downward-pointing arrow connects the "Candidate Hypothesis" box to the "Evaluation" box.
* **Label:** None.
### Key Observations
* **Feedback Loops:** There are two distinct feedback loops in the diagram. The first is between Triggers and Knowledge Representations. The second is internal to the central processing hub, between Knowledge Representations and Computational Methods.
* **Convergence of AI Paradigms:** The "Knowledge Representations" section notably combines modern neural/statistical AI (`LLMs`) with traditional symbolic AI (`Knowledge Graphs`, `Propositional Knowledge Bases`).
* **Funneling Effect:** The system moves from multiple inputs (triggers), through complex cyclical processing, generates multiple outputs (Hypotheses 1, 2, 3), and ultimately funnels down to a single, actionable output in the Evaluation phase.
### Interpretation
This diagram outlines a sophisticated architecture for an autonomous agent or advanced AI system based on **Peircean Abductive Reasoning**. In Charles Sanders Peirce's philosophy, abduction is the process of forming an explanatory hypothesis in response to an anomaly.
The diagram maps this cognitive process perfectly:
1. **The Anomaly:** Existing knowledge dictates what the system expects to see (`dictate expectations of suprise for`). When an input violates these expectations (`Surprising Observations`), it acts as a trigger.
2. **The Restructuring:** This surprise forces the system to update its worldview (`prompt the restructuring of`). It does this by applying rigorous `Computational Methods` (logic, probability, graph math) to its existing `Knowledge Representations` (LLMs, KGs). The representations determine what computations are possible, and the computations are performed on the representations to alter them.
3. **Hypothesis Generation:** This internal engine does not produce a single definitive answer; rather, the combined systems (`together produce`) generate a set of plausible explanations (`Candidate Hypothesis 1, 2, 3`).
4. **Actionable Output:** Because an agent cannot act on multiple conflicting theories simultaneously, these candidates must pass through an `Evaluation` phase. The surviving hypothesis is no longer just a theory; it becomes the pragmatic `basis for action`.
Ultimately, the diagram demonstrates a blueprint for moving AI beyond simple pattern recognition into the realm of dynamic reasoning, where systems can independently notice when they are wrong, compute why, and formulate a plan to adapt.