\n
## Diagram: Abductive Reasoning Process
### Overview
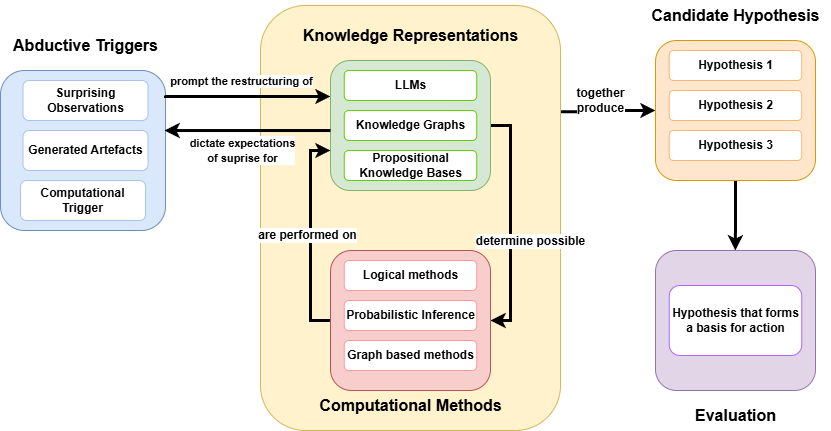
This diagram illustrates the process of abductive reasoning, outlining the triggers, knowledge representations, computational methods, and resulting hypothesis evaluation. The diagram uses boxes and arrows to show the flow of information and relationships between different components. It is divided into four main sections: Abductive Triggers, Knowledge Representations, Computational Methods, and Evaluation.
### Components/Axes
The diagram consists of the following components:
* **Abductive Triggers:** Includes "Surprising Observations", "Generated Artefacts", and "Computational Trigger".
* **Knowledge Representations:** Includes "LLMs", "Knowledge Graphs", and "Propositional Knowledge Bases".
* **Computational Methods:** Includes "Logical methods", "Probabilistic Inference", and "Graph based methods".
* **Candidate Hypothesis:** Includes "Hypothesis 1", "Hypothesis 2", and "Hypothesis 3".
* **Evaluation:** Includes "Hypothesis that forms a basis for action".
Arrows indicate the direction of influence or processing. Text labels on the arrows describe the nature of the relationship.
### Detailed Analysis or Content Details
**Abductive Triggers (Left Side - Light Blue):**
* "Surprising Observations" is a rectangular box.
* "Generated Artefacts" is a rectangular box.
* "Computational Trigger" is a rectangular box.
* An arrow labeled "prompt the restructuring of" points from "Abductive Triggers" to "Knowledge Representations".
* An arrow labeled "dictate expectations of surprise for" points from "Abductive Triggers" to "Knowledge Representations".
**Knowledge Representations (Center-Left - Yellow):**
* "LLMs" is a rectangular box.
* "Knowledge Graphs" is a rectangular box.
* "Propositional Knowledge Bases" is a rectangular box.
* An arrow labeled "together produce" points from "Knowledge Representations" to "Computational Methods".
**Computational Methods (Bottom-Center - Light Orange):**
* "Logical methods" is a rectangular box.
* "Probabilistic Inference" is a rectangular box.
* "Graph based methods" is a rectangular box.
* An arrow labeled "are performed on" points from "Knowledge Representations" to "Computational Methods".
* An arrow labeled "determine possible" points from "Computational Methods" to "Candidate Hypothesis".
**Candidate Hypothesis & Evaluation (Right Side - Light Purple/Pink):**
* "Hypothesis 1" is a rectangular box.
* "Hypothesis 2" is a rectangular box.
* "Hypothesis 3" is a rectangular box.
* "Hypothesis that forms a basis for action" is a rectangular box.
* An arrow points from "Candidate Hypothesis" to "Evaluation".
### Key Observations
The diagram highlights a cyclical process. Abductive triggers initiate a restructuring of knowledge representations, which are then processed by computational methods to generate candidate hypotheses. These hypotheses are then evaluated, potentially leading to action. The diagram emphasizes the interplay between observation, knowledge, computation, and action in abductive reasoning.
### Interpretation
The diagram illustrates a computational model of abductive reasoning. Abduction, in philosophy and AI, is a form of logical inference that starts with an observation and seeks the simplest and most likely explanation. This diagram breaks down that process into distinct stages.
* **Triggers:** The process begins with something unexpected – a surprising observation, an artifact that doesn't fit existing models, or a computational signal.
* **Knowledge Representation:** These triggers prompt a restructuring of existing knowledge, represented here by LLMs (Large Language Models), Knowledge Graphs, and Propositional Knowledge Bases. These are different ways of storing and organizing information.
* **Computational Methods:** The restructured knowledge is then subjected to computational methods – logical reasoning, probabilistic inference, and graph-based analysis – to generate possible explanations.
* **Hypothesis Generation & Evaluation:** These methods produce a set of candidate hypotheses, which are then evaluated to determine which one best explains the initial observation and forms a basis for action.
The diagram suggests that abductive reasoning is not simply a matter of finding the "right" answer, but rather a process of generating and evaluating multiple possibilities. The use of LLMs, Knowledge Graphs, and probabilistic methods indicates a modern, computational approach to this traditionally philosophical problem. The diagram doesn't provide specific data or numerical values, but rather a conceptual framework for understanding the process.