## Flowchart: Cognitive Process for Hypothesis Generation and Evaluation
### Overview
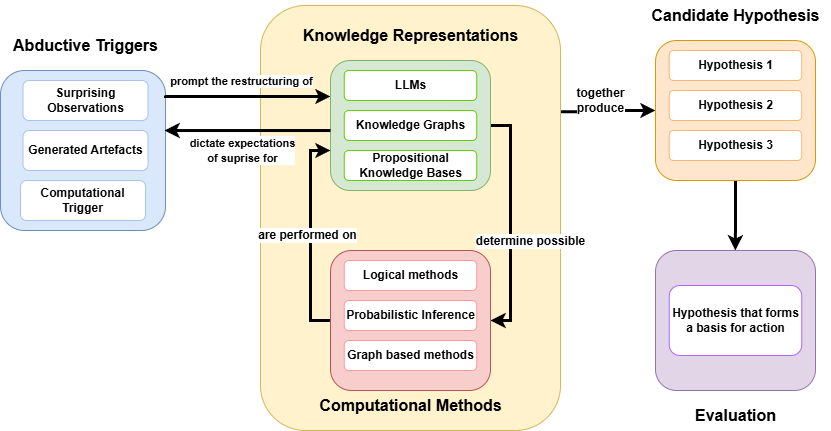
This diagram illustrates a cognitive framework for generating and evaluating hypotheses through abductive reasoning. It depicts the flow from initial triggers through knowledge representations to computational methods, culminating in actionable hypotheses.
### Components/Axes
1. **Abductive Triggers (Left Box, Blue)**
- Surprising Observations
- Generated Artefacts
- Computational Trigger
- Arrows labeled:
- "prompt the restructuring of"
- "dictate expectations of surprise for"
2. **Knowledge Representations (Central Box, Yellow)**
- **Sub-components (Green Box):**
- LLMs
- Knowledge Graphs
- Propositional Knowledge Bases
- **Computational Methods (Pink Box):**
- Logical methods
- Probabilistic Inference
- Graph-based methods
- Arrows labeled:
- "are performed on"
- "determine possible"
3. **Candidate Hypothesis (Right Box, Orange)**
- Hypothesis 1
- Hypothesis 2
- Hypothesis 3
- Arrow labeled: "together produce"
4. **Evaluation (Purple Box)**
- Final output: "Hypothesis that forms a basis for action"
### Detailed Analysis
- **Flow Direction:**
- Left → Center: Abductive triggers initiate knowledge restructuring
- Center → Right: Computational methods process knowledge representations to generate hypotheses
- Right → Bottom: Evaluation refines hypotheses into actionable forms
- **Key Connections:**
- Surprising Observations directly influence LLMs and Knowledge Graphs
- Generated Artefacts feed into Propositional Knowledge Bases
- Computational Trigger enables all computational methods
- All computational methods contribute to hypothesis generation
### Key Observations
1. The framework emphasizes iterative refinement through multiple hypothesis generations
2. Computational methods serve as the bridge between raw knowledge and hypothesis formation
3. Evaluation acts as a quality control step before action implementation
4. No numerical data present; purely conceptual flow diagram
### Interpretation
This diagram represents a formalized model of abductive reasoning in AI systems. The blue-to-yellow-to-orange-to-purple color progression visually represents the transition from raw data (triggers) to structured knowledge (representations) to synthesized understanding (hypotheses) and finally to validated action (evaluation). The absence of quantitative metrics suggests this is a conceptual rather than empirical framework, focusing on process flow rather than performance metrics. The use of "together produce" for hypothesis generation implies collaborative or ensemble-based reasoning approaches.