# Technical Document Extraction: Training Loss Analysis
## 1. Document Metadata
* **Title:** Training Loss: Gradient Norm vs. Epsilon
* **Type:** Line Graph with markers
* **Language:** English
## 2. Component Isolation
### Header
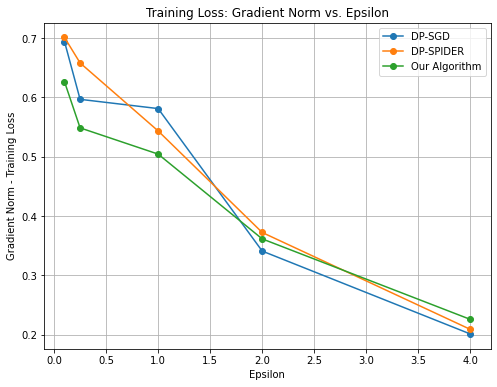
* **Main Title:** Training Loss: Gradient Norm vs. Epsilon
### Main Chart Area
* **Y-Axis Label:** Gradient Norm - Training Loss
* **Y-Axis Scale:** Linear, ranging from 0.2 to 0.7 with major ticks every 0.1.
* **X-Axis Label:** Epsilon
* **X-Axis Scale:** Linear, ranging from 0.0 to 4.0 with major ticks every 0.5.
* **Grid:** Major grid lines are present for both X and Y axes.
### Legend (Spatial Grounding: Top Right [x≈0.8, y≈0.9])
* **Blue Line with Circle Marker:** DP-SGD
* **Orange Line with Circle Marker:** DP-SPIDER
* **Green Line with Circle Marker:** Our Algorithm
## 3. Data Series Analysis and Trend Verification
### Series 1: DP-SGD (Blue)
* **Trend:** This series shows a sharp initial drop, followed by a plateau between Epsilon 0.25 and 1.0, then a steady decline to the lowest final value.
* **Data Points (Approximate):**
* Epsilon 0.1: ~0.69
* Epsilon 0.25: ~0.60
* Epsilon 1.0: ~0.58
* Epsilon 2.0: ~0.34
* Epsilon 4.0: ~0.20
### Series 2: DP-SPIDER (Orange)
* **Trend:** This series exhibits a consistent downward slope across the entire range. It starts as the highest value and ends as the middle value.
* **Data Points (Approximate):**
* Epsilon 0.1: ~0.70
* Epsilon 0.25: ~0.66
* Epsilon 1.0: ~0.54
* Epsilon 2.0: ~0.37
* Epsilon 4.0: ~0.21
### Series 3: Our Algorithm (Green)
* **Trend:** This series starts with the lowest initial value. It shows a steep drop initially, then a more gradual, linear-like decline. It crosses the other lines to end with the highest final value at Epsilon 4.0.
* **Data Points (Approximate):**
* Epsilon 0.1: ~0.63
* Epsilon 0.25: ~0.55
* Epsilon 1.0: ~0.51
* Epsilon 2.0: ~0.36
* Epsilon 4.0: ~0.23
## 4. Comparative Summary Table
| Epsilon | DP-SGD (Blue) | DP-SPIDER (Orange) | Our Algorithm (Green) |
| :--- | :--- | :--- | :--- |
| **0.1** | 0.69 | 0.70 | 0.63 |
| **0.25** | 0.60 | 0.66 | 0.55 |
| **1.0** | 0.58 | 0.54 | 0.51 |
| **2.0** | 0.34 | 0.37 | 0.36 |
| **4.0** | 0.20 | 0.21 | 0.23 |
## 5. Key Observations
* **Inverse Relationship:** There is a clear inverse relationship between Epsilon and the Gradient Norm (Training Loss) for all three algorithms; as Epsilon increases, the loss decreases.
* **Low Epsilon Performance:** At low Epsilon values (0.1 to 1.0), "Our Algorithm" (Green) consistently maintains a lower training loss compared to the other two baselines.
* **High Epsilon Convergence:** As Epsilon reaches 4.0, the performance of all three algorithms converges significantly, with DP-SGD achieving the lowest absolute value (~0.20) and "Our Algorithm" being slightly higher (~0.23).
* **Crossover Point:** A significant convergence/crossover occurs around Epsilon 2.0, where all three algorithms produce a Gradient Norm between 0.34 and 0.37.