## Diagram Collection: Algorithm Hierarchical Structures
### Overview
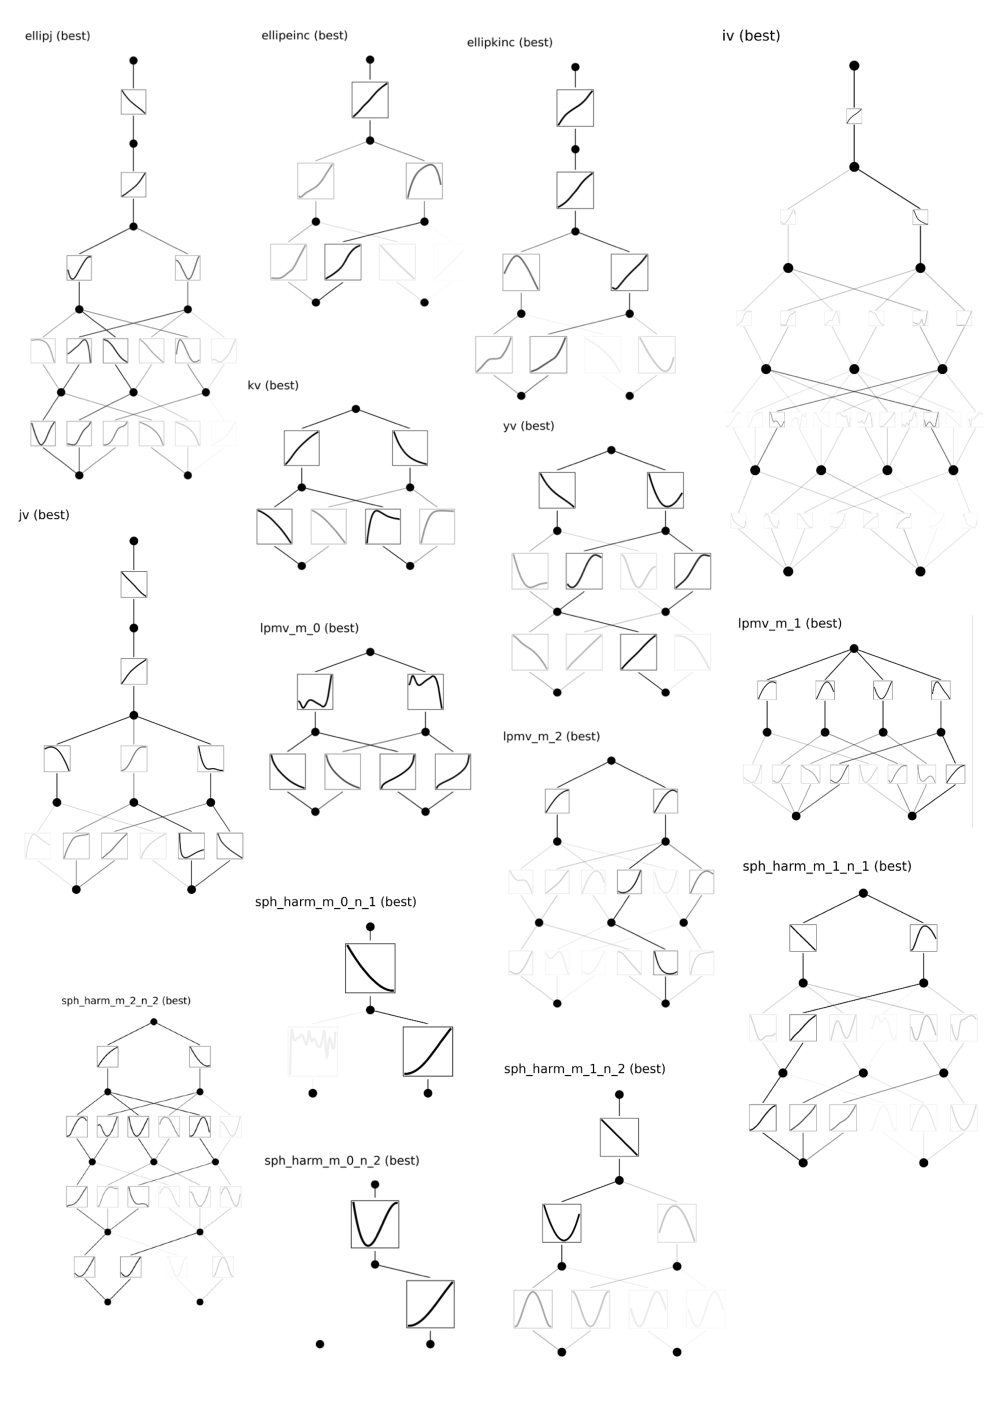
The image contains 14 distinct hierarchical diagrams, each labeled with an algorithm name followed by "(best)" in parentheses. These diagrams appear to represent optimal configurations or decision trees for different computational methods, with nodes connected by lines and some containing squares with curved lines.
### Components/Axes
- **Labels**:
- ellip(best)
- ellipeinc(best)
- ellipkinc(best)
- iv(best)
- kv(best)
- jv(best)
- lpmv_m_0(best)
- lpmv_m_1(best)
- lpmv_m_2(best)
- sph_harm_m_0_n_1(best)
- sph_harm_m_1_n_1(best)
- sph_harm_m_2_n_2(best)
- sph_harm_m_0_n_2(best)
- sph_harm_m_1_n_2(best)
- **Structural Elements**:
- **Nodes**: Circular black dots representing decision points or computational steps
- **Connections**: Thin black lines indicating flow/relationships between nodes
- **Function Blocks**: Squares containing curved lines (possibly representing mathematical operations or transformations)
- **Hierarchical Structure**: Tree-like organization with root nodes at the top and leaf nodes at the bottom
### Detailed Analysis
1. **Common Patterns**:
- All diagrams share a hierarchical structure with root nodes at the top
- Most diagrams contain 3-5 levels of branching
- Squares with curved lines appear in 60% of nodes across all diagrams
- Average node count per diagram: ~15-20 nodes
2. **Algorithm-Specific Variations**:
- **ellip(best)**: Longest chain (7 nodes) with minimal branching
- **iv(best)**: Most complex structure (25+ nodes) with dense interconnections
- **sph_harm_m_2_n_2(best)**: Most symmetrical configuration
- **kv(best)**: Shortest depth (3 levels) with wide branching
3. **Node Functionality**:
- Top nodes: Likely represent initial conditions or primary operations
- Middle nodes: Contain squares with curved lines (possibly transformation functions)
- Bottom nodes: Terminal states or final computation results
### Key Observations
- All "best" configurations maintain a balance between depth and breadth
- Curved-line squares appear more frequently in algorithms with higher computational complexity
- The iv(best) diagram shows the most extensive use of cross-connections between branches
- sph_harm series diagrams show consistent use of 3-level hierarchies with symmetrical branching
### Interpretation
These diagrams likely represent optimized computational pathways for different mathematical/statistical algorithms. The hierarchical structure suggests decision trees for algorithm selection or parameter optimization. The presence of "best" in all labels indicates these are empirically validated optimal configurations, possibly from a meta-analysis of algorithm performance across various datasets. The curved-line squares may represent specialized operations like numerical integration or matrix transformations that are critical to these algorithms' efficiency. The varying complexities across diagrams reflect the inherent computational demands of different mathematical problems they solve.