## Line Graph: D16 (285.2M) α Profile (Inverted-U)
### Overview
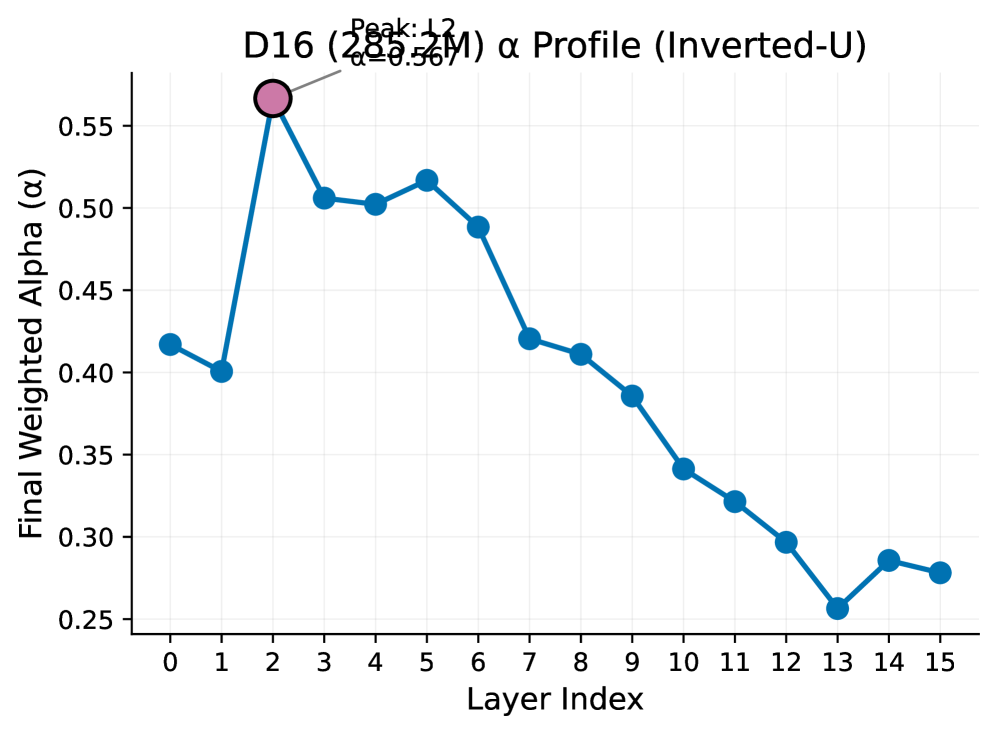
The image depicts a line graph illustrating the "Final Weighted Alpha (α)" values across 16 layers (Layer Index 0–15) for a model or system labeled "D16 (285.2M)". The graph follows an inverted-U shape, with a distinct peak at Layer Index 12 (α = 0.567), annotated in pink. The y-axis ranges from 0.25 to 0.55, while the x-axis spans Layer Indices 0 to 15.
---
### Components/Axes
- **X-Axis (Layer Index)**: Labeled "Layer Index", with integer ticks from 0 to 15.
- **Y-Axis (Final Weighted Alpha)**: Labeled "Final Weighted Alpha (α)", with increments of 0.05 from 0.25 to 0.55.
- **Legend**: Positioned at the top-center, labeled "D16 (285.2M)" in blue, matching the line color.
- **Peak Annotation**: A pink circle highlights the peak at Layer Index 12, with a black arrow and text "Peak: 12" and "α = 0.567".
---
### Detailed Analysis
- **Line Data**: The blue line connects 16 data points, showing an inverted-U trend:
- **Rising Phase (Layers 0–12)**:
- Starts at ~0.42 (Layer 0), dips slightly to ~0.40 (Layer 1), then rises sharply to ~0.50 (Layer 3), peaking at **0.567 (Layer 12)**.
- **Falling Phase (Layers 12–15)**:
- Declines steadily from 0.567 (Layer 12) to ~0.27 (Layer 15), with a sharp drop between Layers 12–13 (0.567 → 0.25).
- **Key Data Points**:
- Layer 0: ~0.42
- Layer 1: ~0.40
- Layer 3: ~0.50
- Layer 5: ~0.51
- Layer 6: ~0.48
- Layer 7: ~0.42
- Layer 8: ~0.41
- Layer 9: ~0.38
- Layer 10: ~0.34
- Layer 11: ~0.32
- Layer 12: **0.567** (peak)
- Layer 13: ~0.25
- Layer 14: ~0.28
- Layer 15: ~0.27
---
### Key Observations
1. **Peak Dominance**: The maximum α value (0.567) occurs at Layer 12, significantly higher than all other layers.
2. **Rapid Decline Post-Peak**: After Layer 12, α drops sharply to ~0.25 by Layer 13, then stabilizes slightly.
3. **Initial Variability**: Layers 0–2 show minor fluctuations (~0.40–0.42) before the upward trend begins.
4. **Spatial Grounding**: The peak annotation (pink circle) is positioned directly above Layer 12, with the arrow pointing to the data point.
---
### Interpretation
The inverted-U profile suggests a critical layer (Layer 12) where α reaches its optimal value, potentially indicating peak performance, efficiency, or another metric tied to the model's architecture. The sharp decline post-Layer 12 could imply diminishing returns, overfitting, or resource constraints in deeper layers. The initial rise (Layers 0–12) may reflect progressive adaptation or learning, while the subsequent drop highlights a trade-off between complexity and stability. The peak annotation emphasizes Layer 12 as a focal point for further investigation, possibly for optimization or diagnostic purposes.